For Transport Fever 2 players, in this guide I will try to help you to use GIS data to create your own high quality map from a real world spot in our world. I spent a lot of time to understand and figure out how it can be done. It is really not too difficult, but you have to know what you should do.
Transport Fever 2 have better support for map editing, but still it is very cumbersome to get a heightmap file if you want a custom map. First it is difficult to get high high quality images in the first place, and then it has to be in a 16 bit pure gray png format, which not too much software support or can create easily.
Requirements
There are a few requirements to complete this help guide. Software we will be using is QGIS[qgis.org] and GIMP[www.gimp.org].
- You should have Transport Fever 2
- You will have to install QGIS[qgis.org] for the elevation data processing. I have used version 3.16 which is today the newest version, but you should be able to complete with another version.
- To make the heightmaps compatible for Transport Fever you will also have to install GIMP[www.gimp.org]. The minimum version should be 2.10.
- DEM (or files in other terrain formats that QGIS supports) file for the area you want to create the map from. There are a wide number of sites where you can download, many are free, and some you will have to pay for. QGIS is also able to combine several files, if you want to cover a larger area. Or if you have high resolution data, but missing underwater level data. In this guide I have used file from Norway provided by Kartverket / Geonorge[www.geonorge.no].
- There are other software available instead of QGIS and GIMP also.
1. QGIS
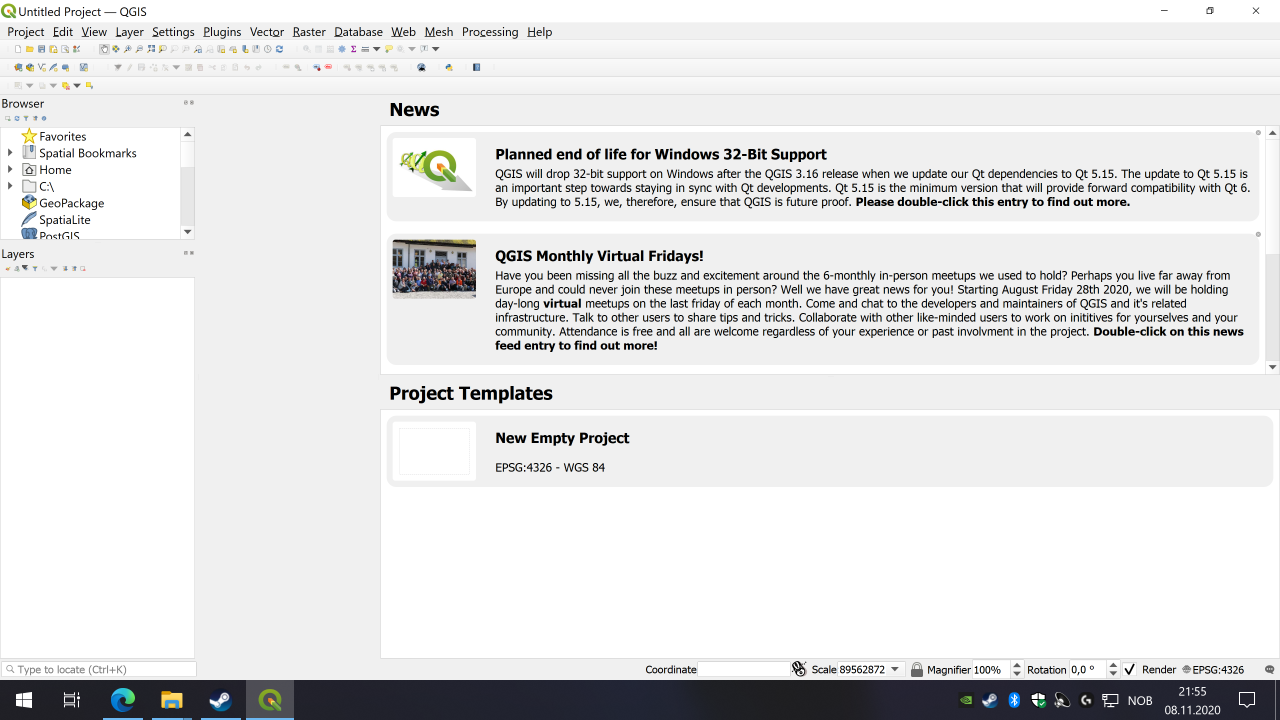
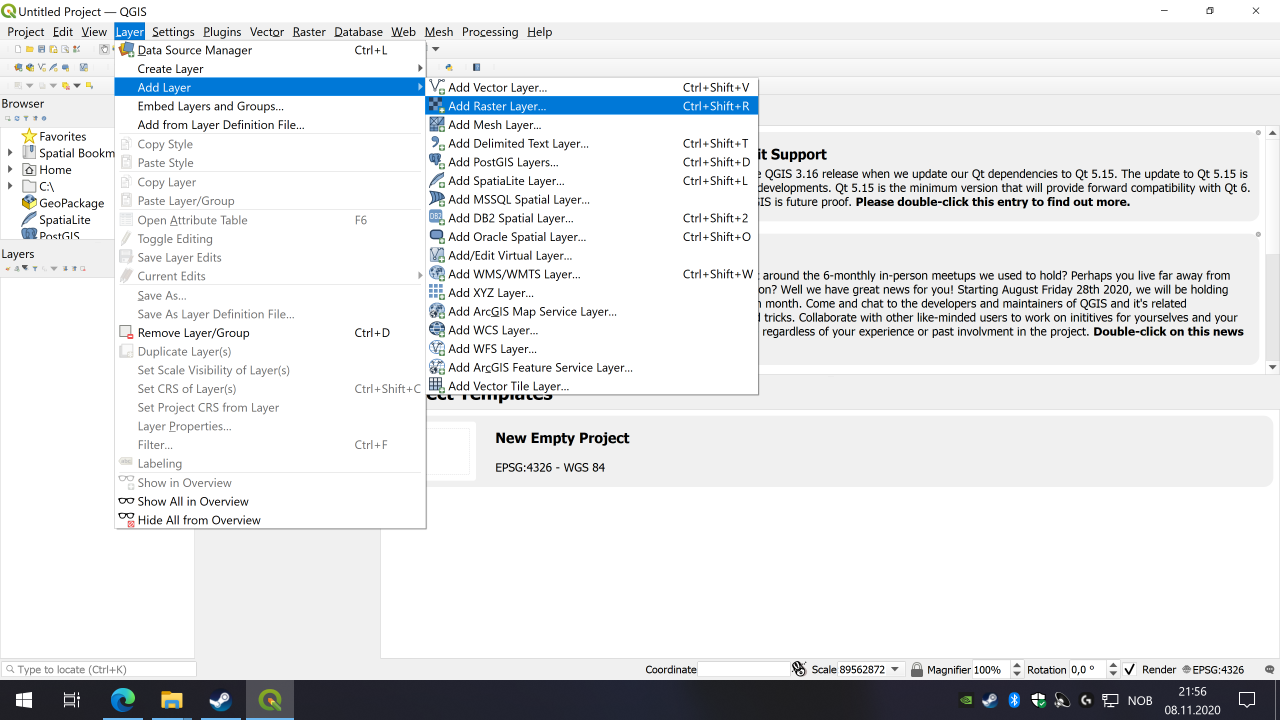
Next go to the menu and select Layer -> Add Layer -> Add Raster Layer… or press (Ctrl-Shift-R).
In the window that comes up, ensure Source Type is File and for Source Raster dataset(s) you will have to press the […] button, and find your .dem file.
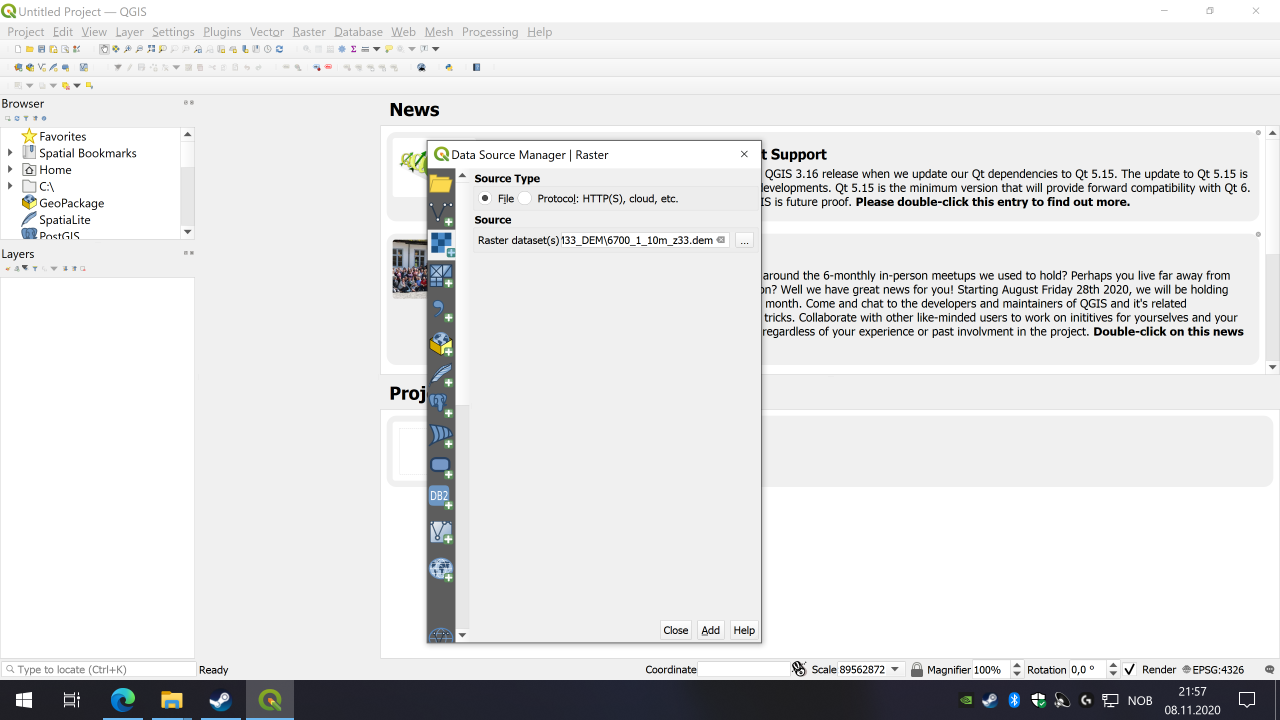
Now press [Add] and then [Close].
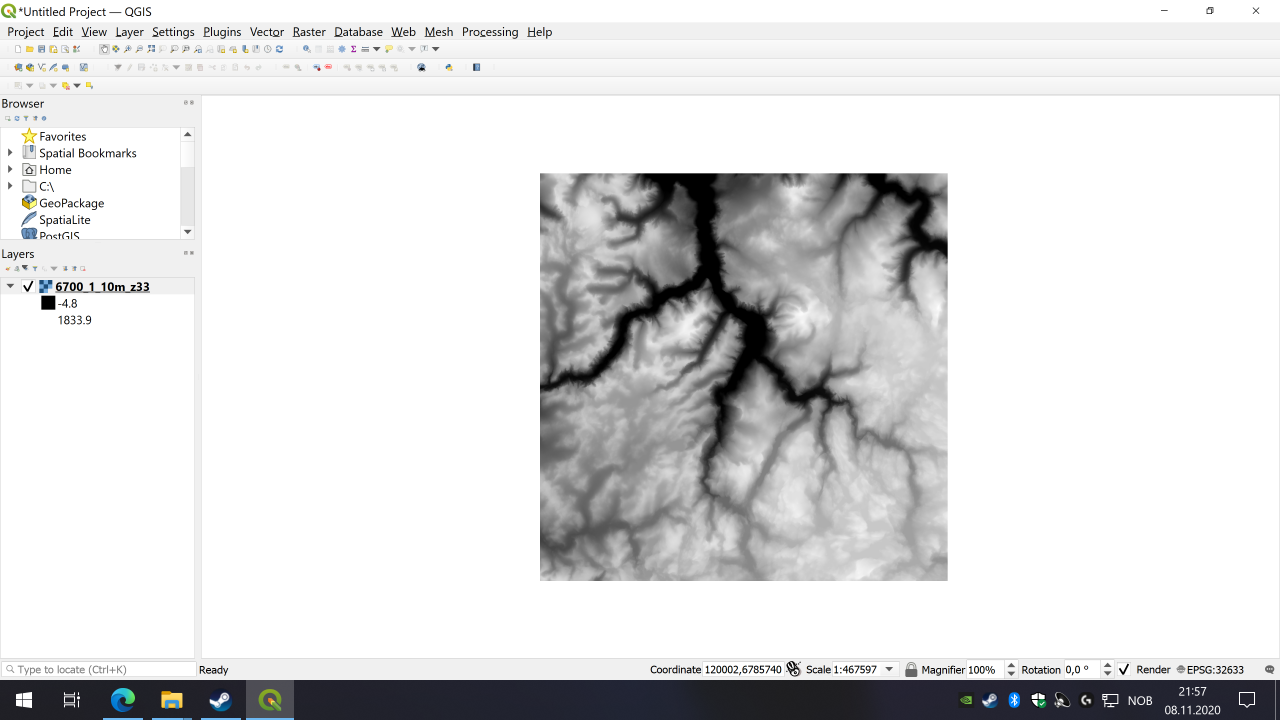
Now look at the left side in the Layers pane. There should be the ID of the DEM, in this case it is 6700_1_10m_z33. Below there are two numbers, -4.8 and 1833.9. You should note those down, as they will be needed a few times later. They represent the lowest and highest elevation in meters (m) respectively in the dataset.
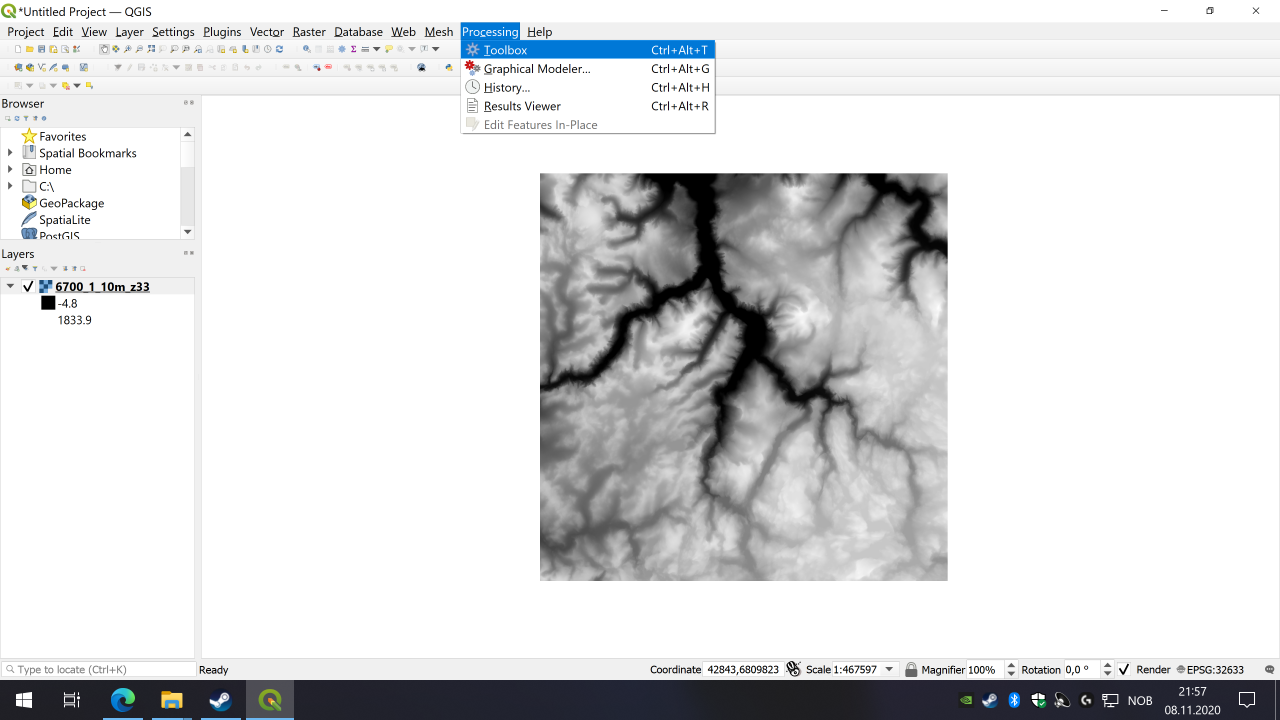
Next go to the menu and click on Processing -> Toolbox or press (Ctrl-Alt-T).
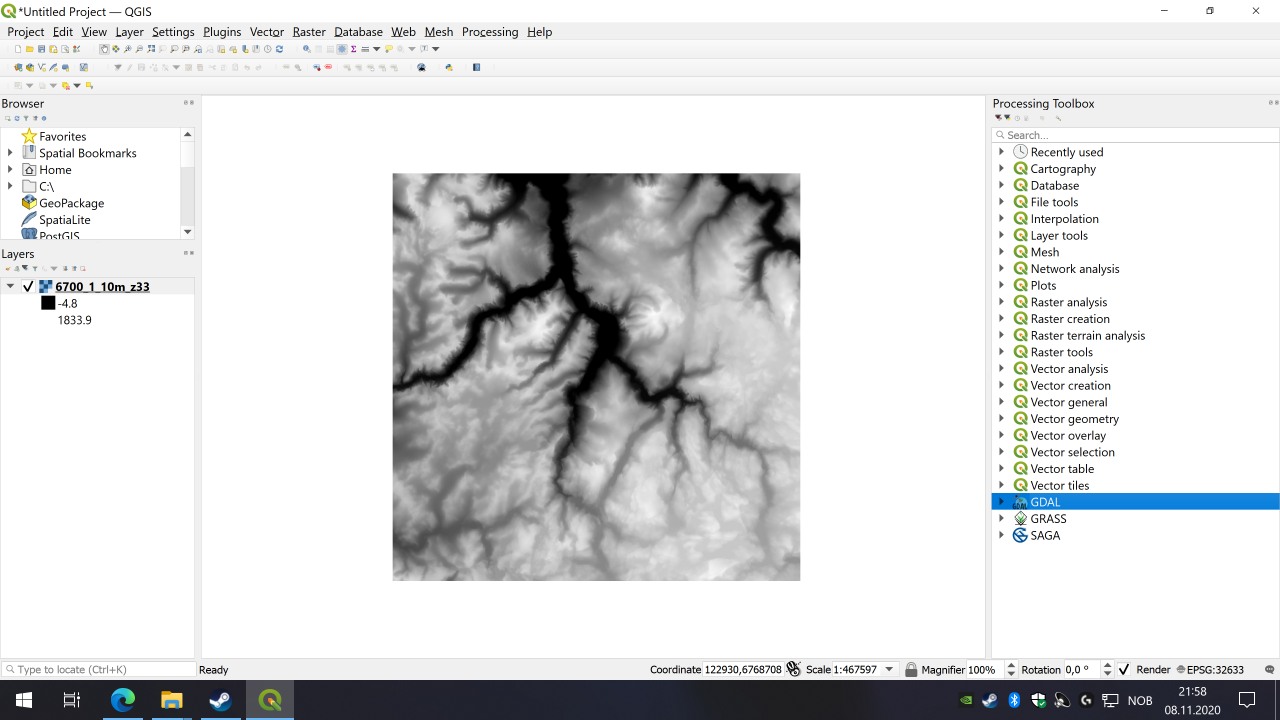
This should bring you a ProcessingToolbox on the right side of the window. Click on GDAL field, so it opens.
Then click further so Raster conversion opens.
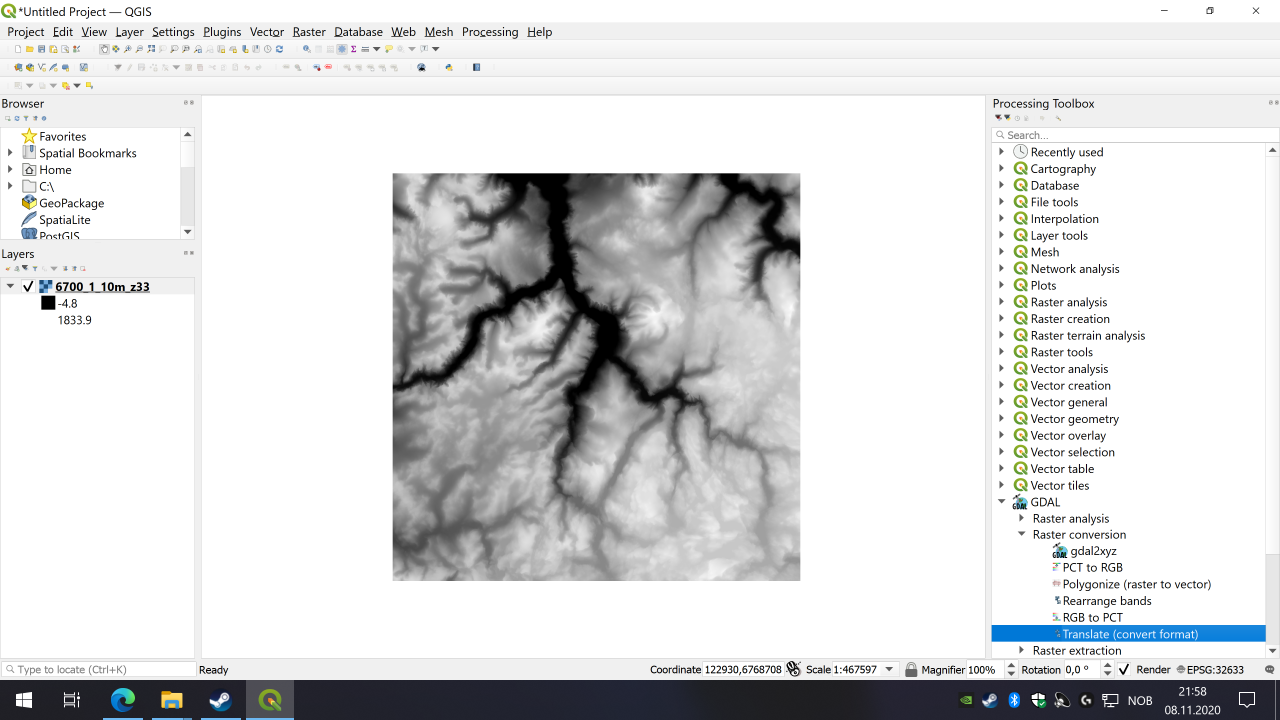
And then double-click on Translate (convert format), and you should have a new window on your screen.
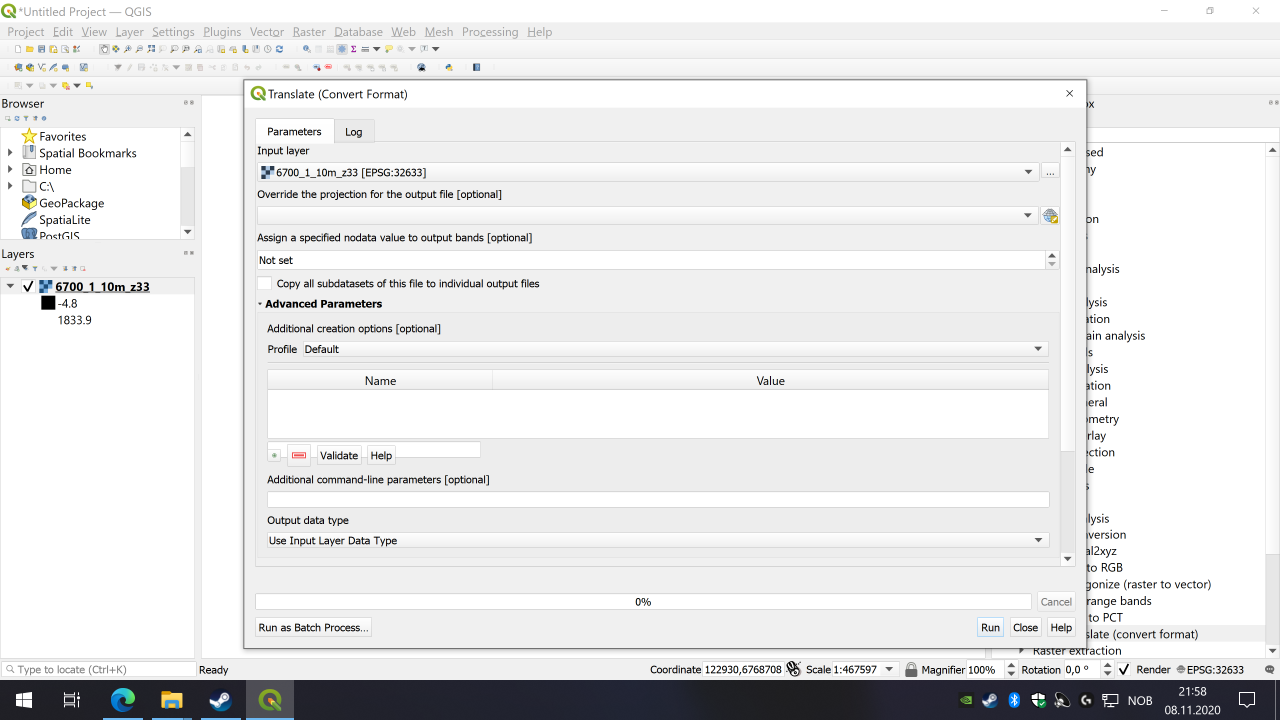
It is recommended to set the best projection for your dataset, otherwise parts might get too skewed (earth is not flat, no matter if you believe it or not). In my case the Project CRS is the best one, and I believe that is recommended in most cases if you are not sure, or leave it empty.
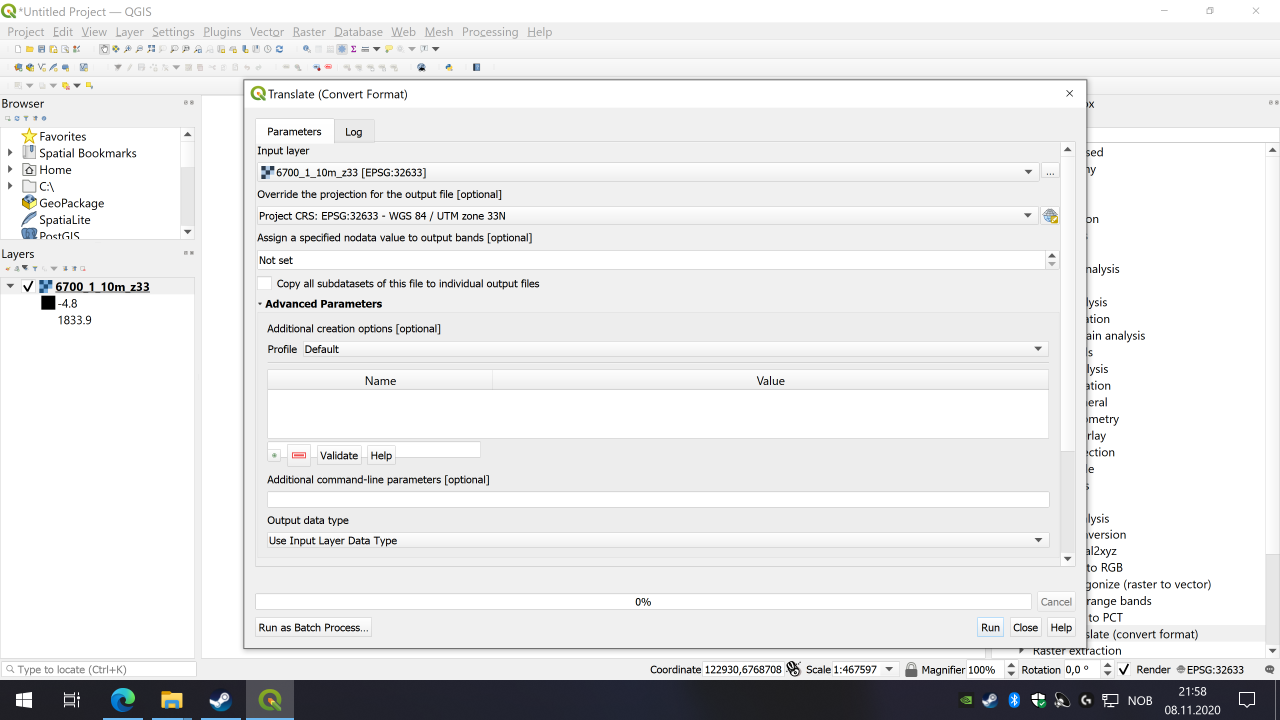
Next is an important step. If you don’t add these you will end up with a file that looks to be only black and white, or possible nothing visible at all.
Under Advanced Parameters go to Additional command-line parameters [optional] and write in
The two first numbers are the one you noted down earlier, so replace those with yours. The next two tells the software to expand those values over the entire positive 32 bit space, so ensure they are written correctly.
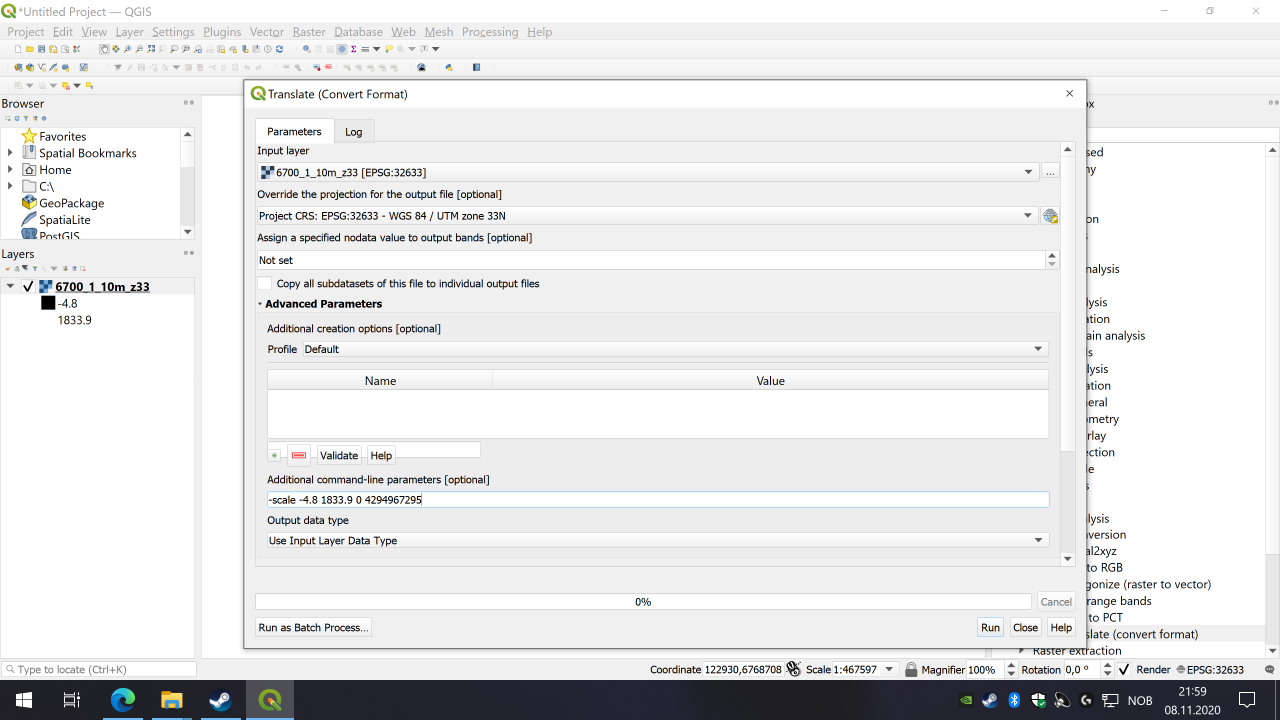
For the Output data type you have to select UInt32.
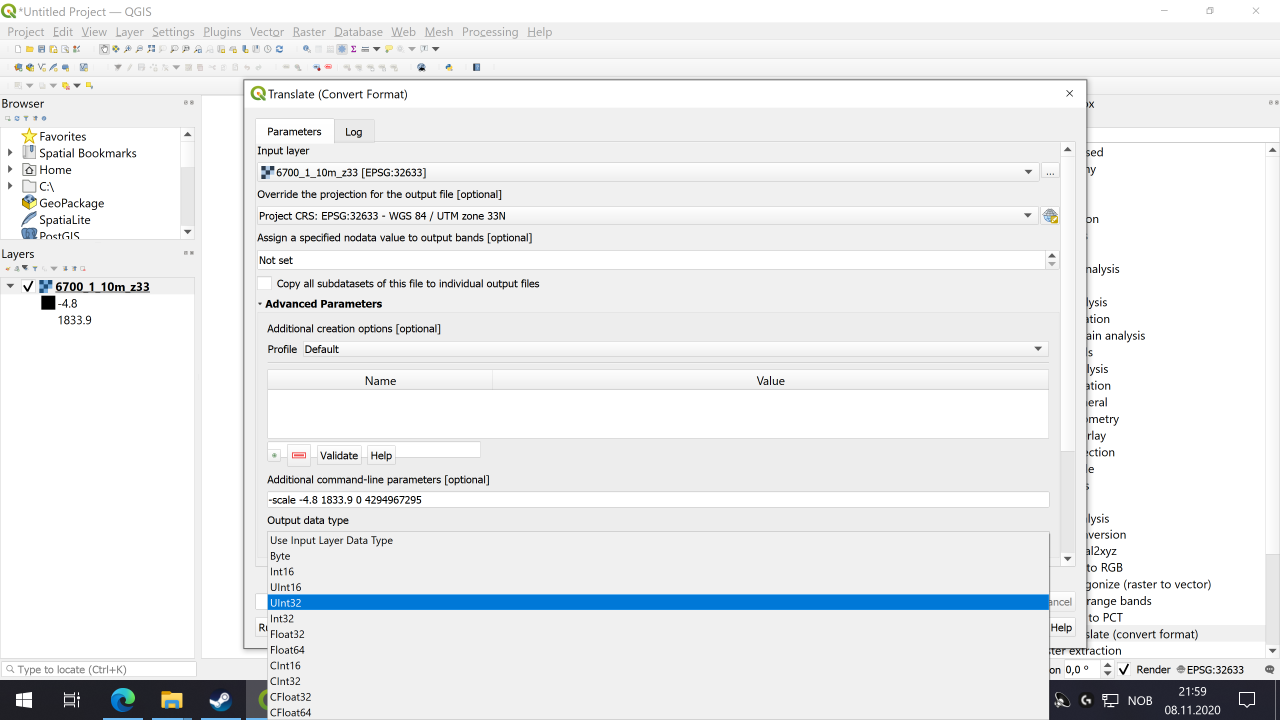
After setting the parameters click on [Run] button, and there should be a log window with lots of text, but hopefully without errors. If there are errors start by checking what it says, and you can go back to setting the parameters again by clicking [Change Parameters]. When all is good, click on [Close]. Now a new field under Layers pane should say somerthing like Converted or similar. Click on it so it is selected if it is not already.
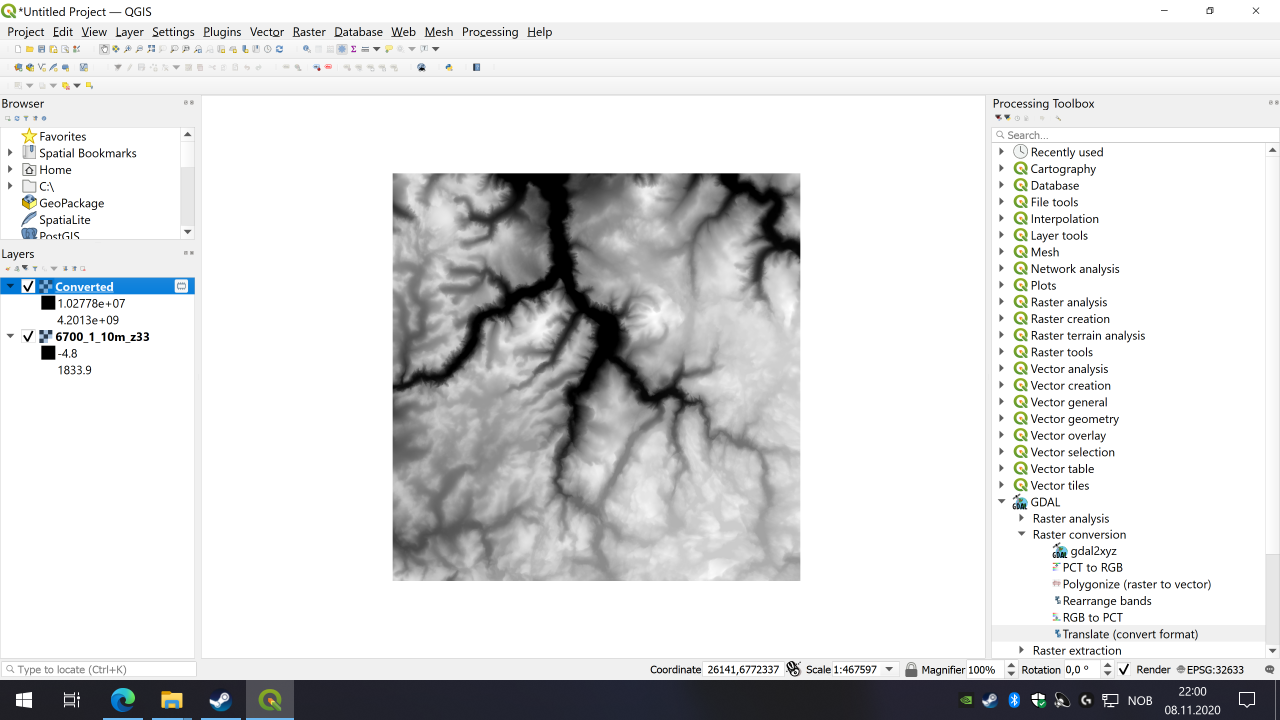
Now go to the Layer menu again and select Save As…
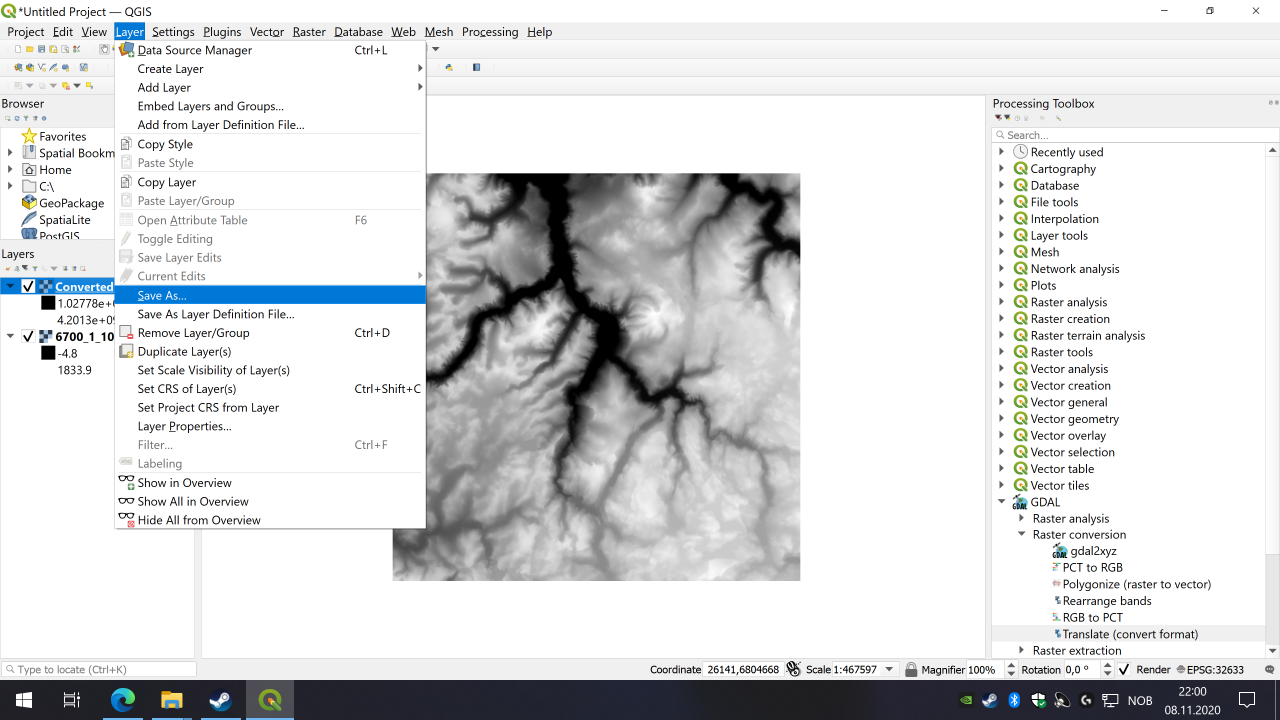
A new window is coming up.
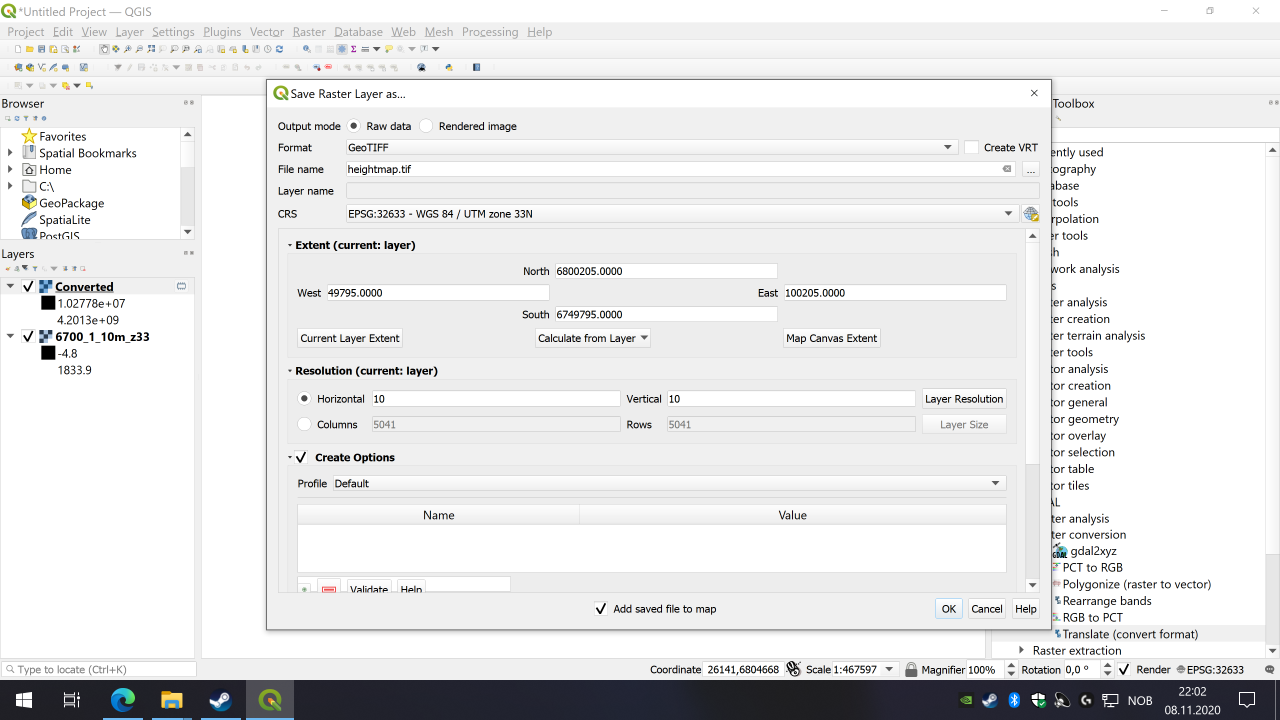
Set Output Mode to Raw data. Format should be GeoTIFF. Choose a filename and where you want to save it by clicking […] at the end of File name line. I call this file heightmap.tif. Remember where you save it. All the other options should be left as default. Note down the figures under Resolution in this case it is 10 for both directions.
Extent describes the longitude and latitude of the square on the earth you are saving, and you could edit if you want a smaller file, or have combined several files and only want a subset. Resolution is the resolution of what your saved file will be, by default it should be set to the resolution of your dataset, in this case it is 10, which is a very high resolution and good quality dataset. All these figures are in meters (m), and refers to meters per pixels. Typically for DEM sets you will find are 90 or 30 meters, you will also see arc seconds, which really is an unit of angel. But for earth (which still is round) one arc second is approximately 30 m. While you can change those figures, I don’t recommend doing it and we will do some editing in GIMP later to convert the resolution, which are better for our purposes.
Click on [OK] and a green bar on the top of the window should hopefully come up and say that save was successful. Now you can close down QGIS.
2. GIMP
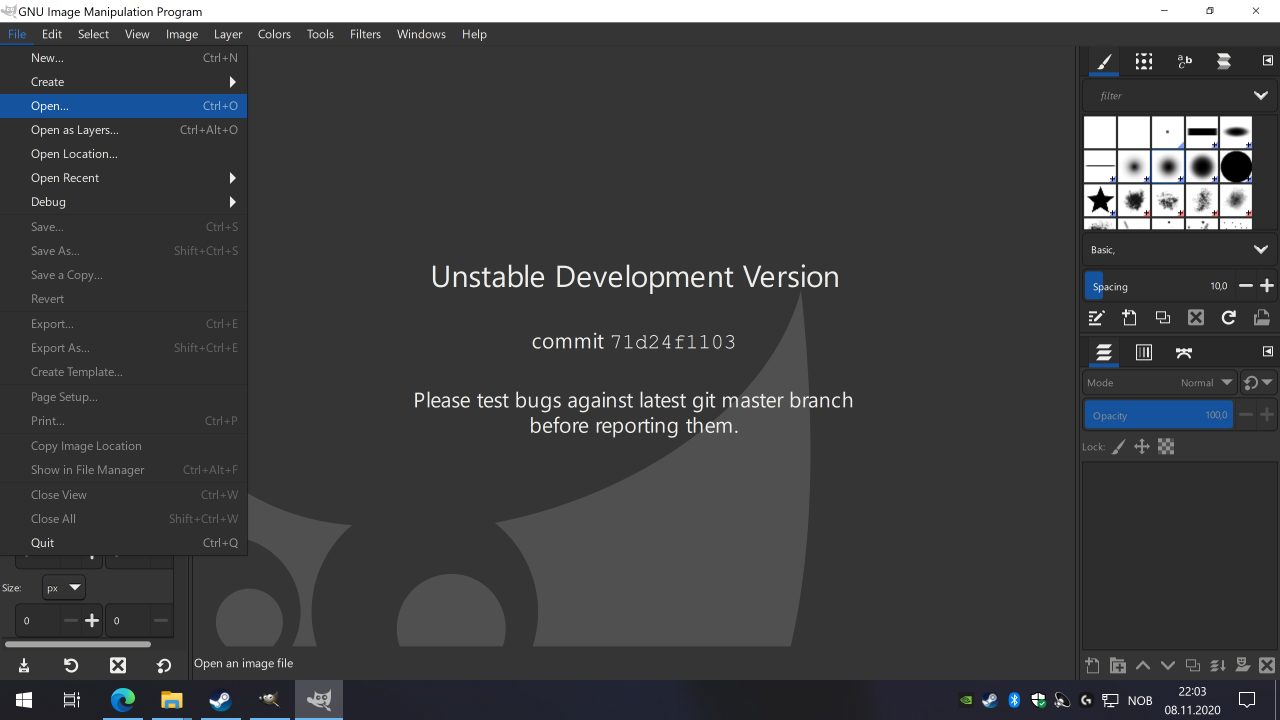
You should see the same familiar height map as from QGIS, but check on the top window bar that it says something like Grayscale 32 bit. If it says something else you will have to check if you missed a step.
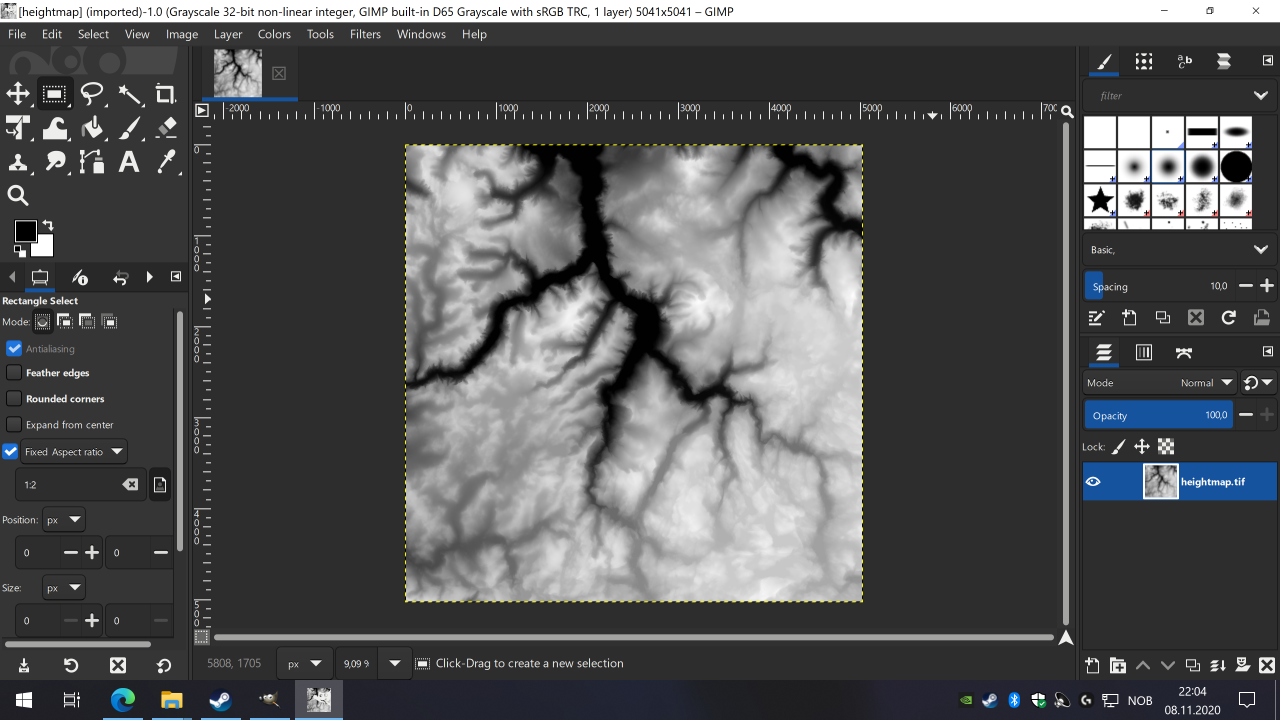
The next few steps are if you want to resize the height map to real life size. You could use it like it is and just jump to the part describing Exporting.
Transport Fever 2 uses a resolution of 4 meters per pixel. The TIFF file generated from our dataset is 10 meters per pixel. Thus we will resize it so it matches the 4 m/pixel. In the Image menu, choose Scale Image…
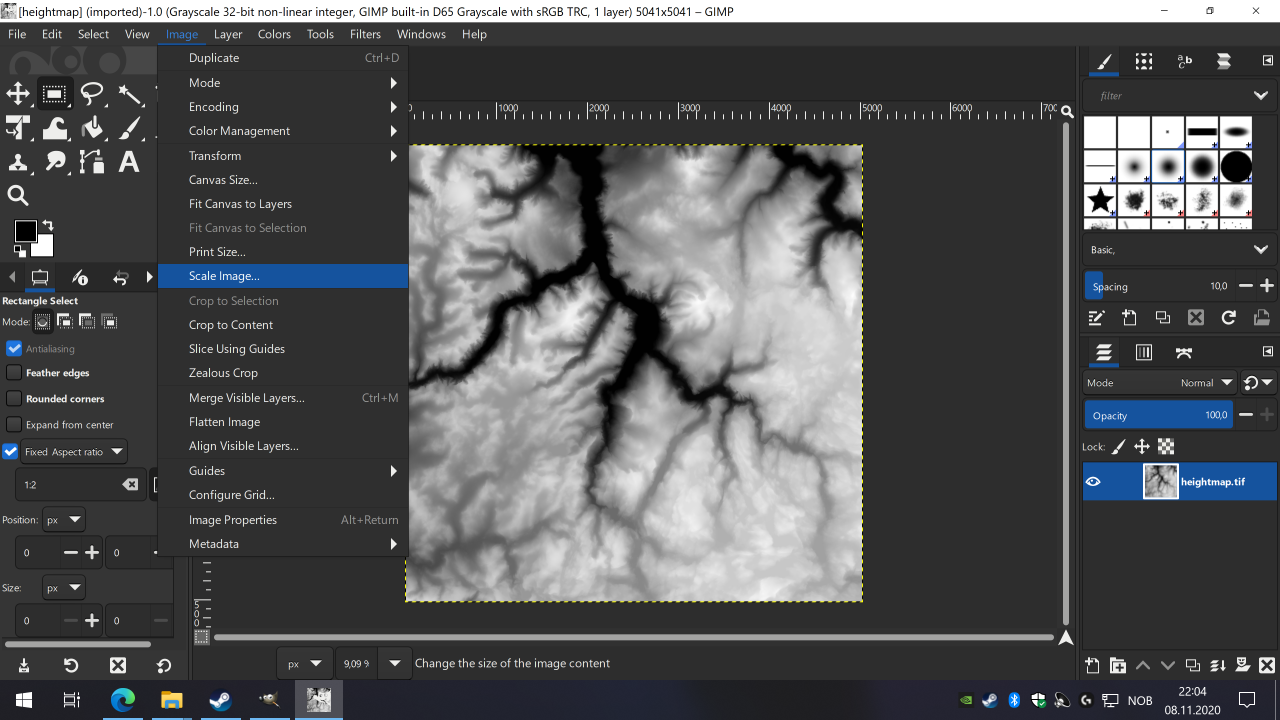
If you have the same resolution in both direction, which we have in our case, and will be in most datasets, if you have default settings in GIMP you can just edit one of the fields if Width or Height. They are linked together. So in width after the number (here it is 5041, which tells us that the file covers 50410 m in both directions, or about 50 km) you write
and you should change 10 to the m/pixel resolution you wrote down before. 4 is of course the Transport Fever resolution it expects.
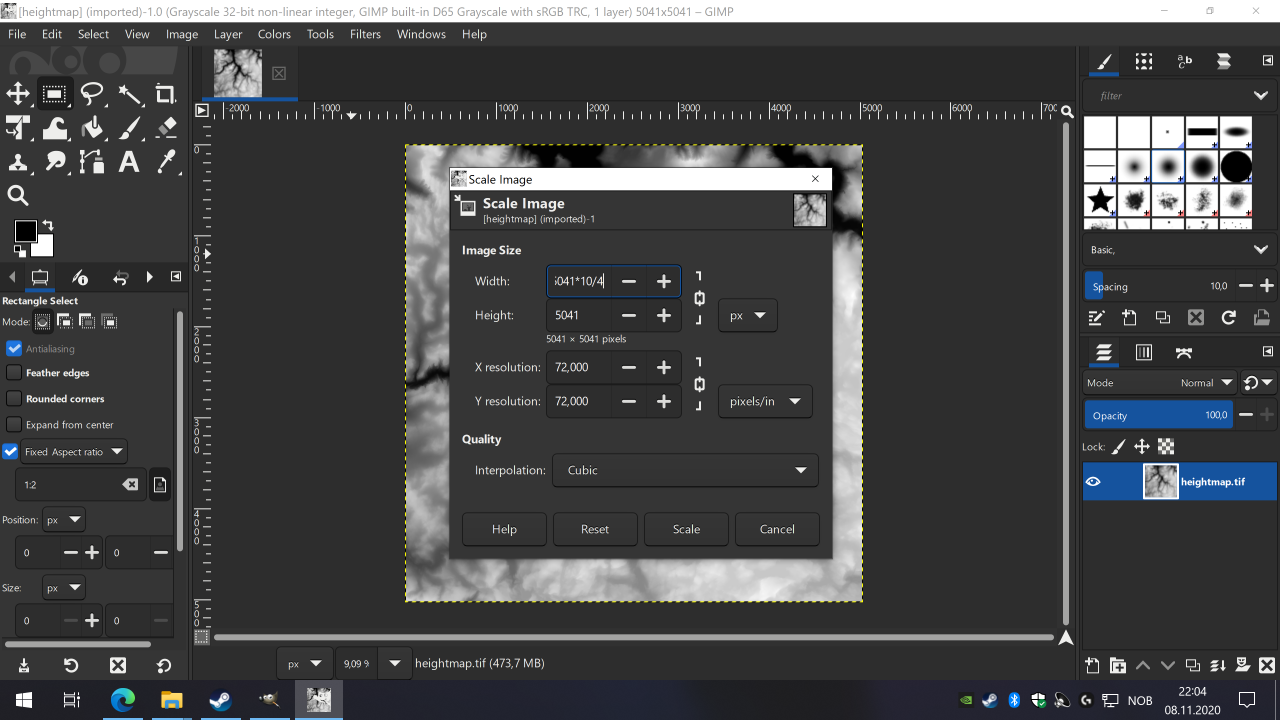
Then press enter and the new value should be shown (I have 12603). For me Cubic interpolation works fine. The memory allocation could become very large, so be aware. If it fails due to memory errors, you have to go back into QGIS and make the size smaller.
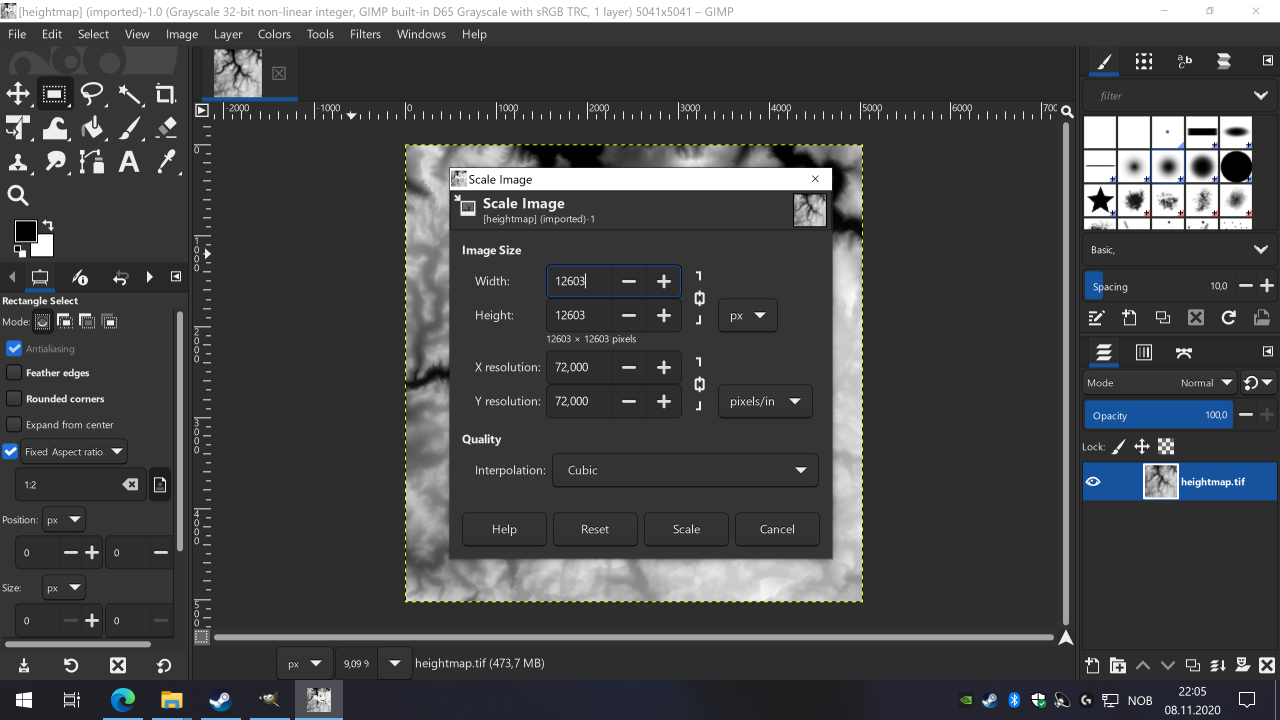
If you want to see the entire file, then in the View menu go to Zoom and select Fit Image in Window (Shift-Ctrl-J).
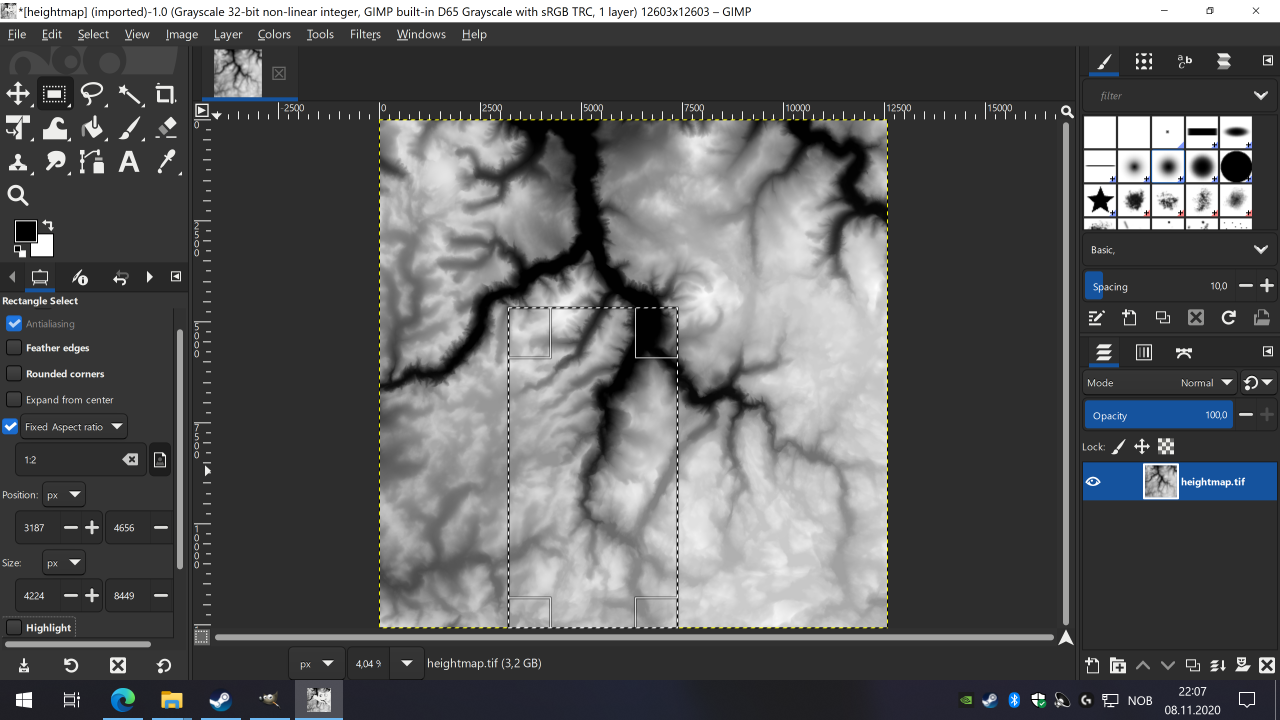
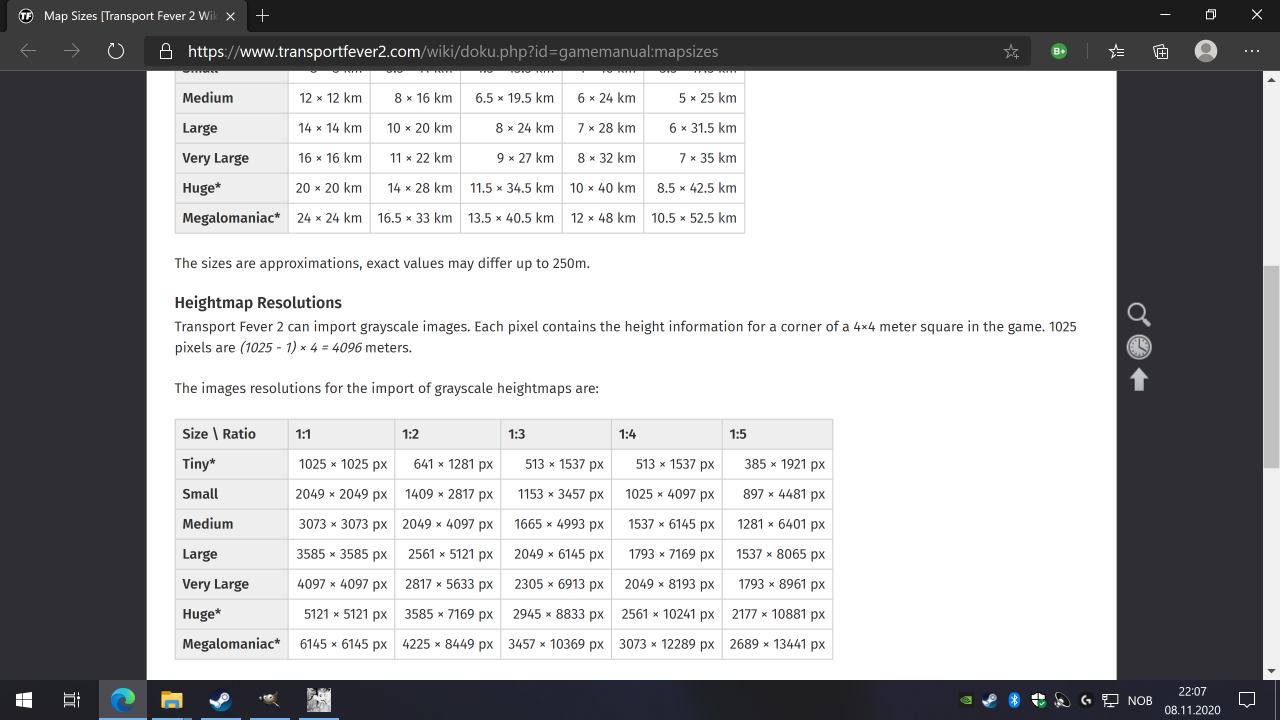
Transport Fever 2 map sizes[www.transportfever2.com] are limited and to get correct size and aspect ratio we will crop the image. For this guide I have chosen to go for a Megalomaniac map with a 1:2 ratio. For your map you should choose a size that fits your requirements. From the linked map sizes table above, that size of a map should equal 16.5 x 33 km. And from the heightmap table on the same link, image resolution should be 4225×8449.
In GIMP the easiest way to crop and image is to select the rectangle selection tool, which you find in the tools pane as a dotted square outline with a solid square inside it. Click on it and below in the settings pane, click on fixed aspect ratio and edit it to 1:2 or the ratio you want to have your map in.
Now you can drag a selection over the image. If you remember our height map is 50×50 km, so the selection should be relatively large. And to set the exact size you go back into the selection setttings and under Size ensure it says px for pixels, and size should be the same as from our table, 4225 and 8449.

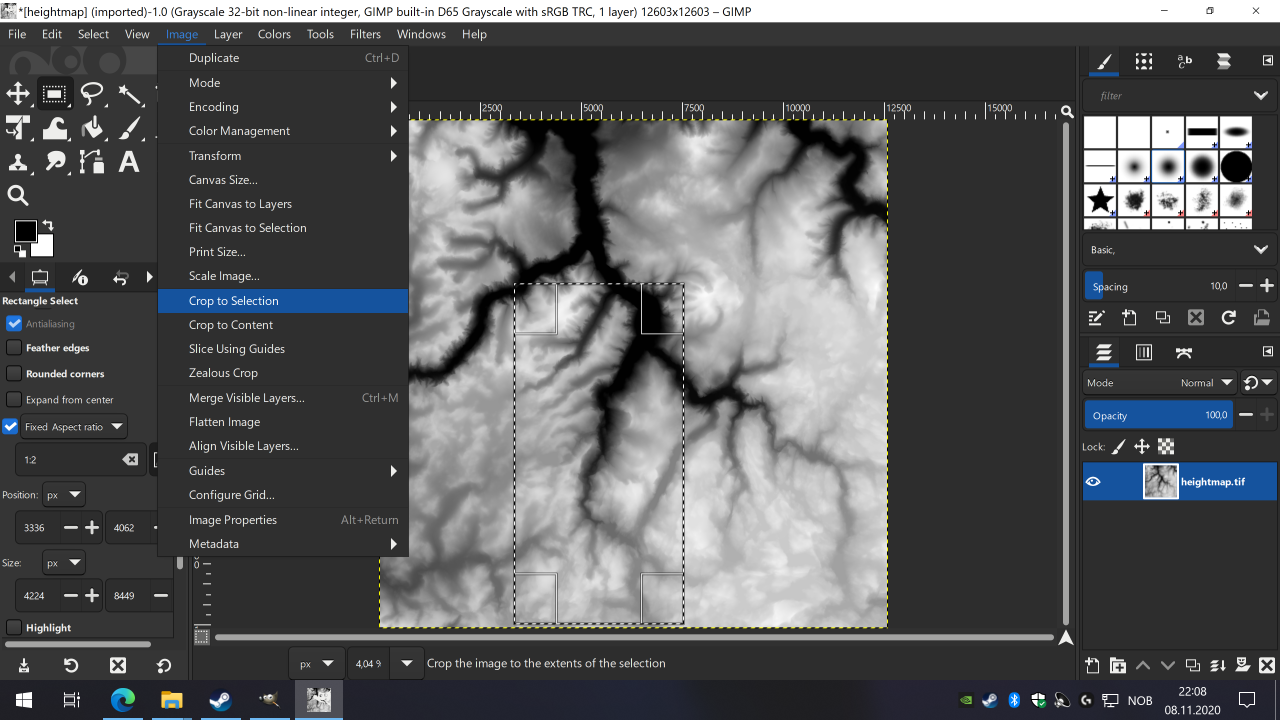
You may have to move the selection around so it is entirely inside the image after you set the selection size. Now go to the Image menu and click on Crop to Selection.
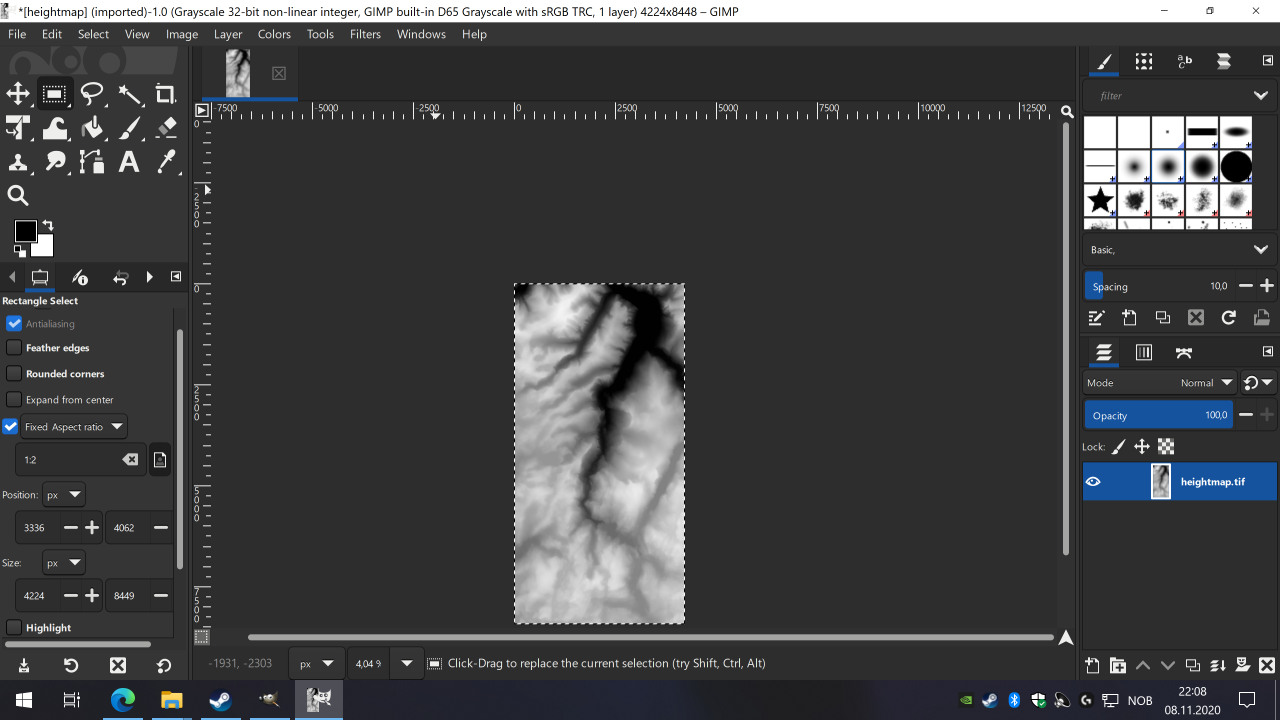
Now the image is in correct size so you can make a map with correct lengths inside Transport Fever 2. And we are ready to export it.
To export our image, go to the File menu and Export As… or press (Shift-Ctrl-E).
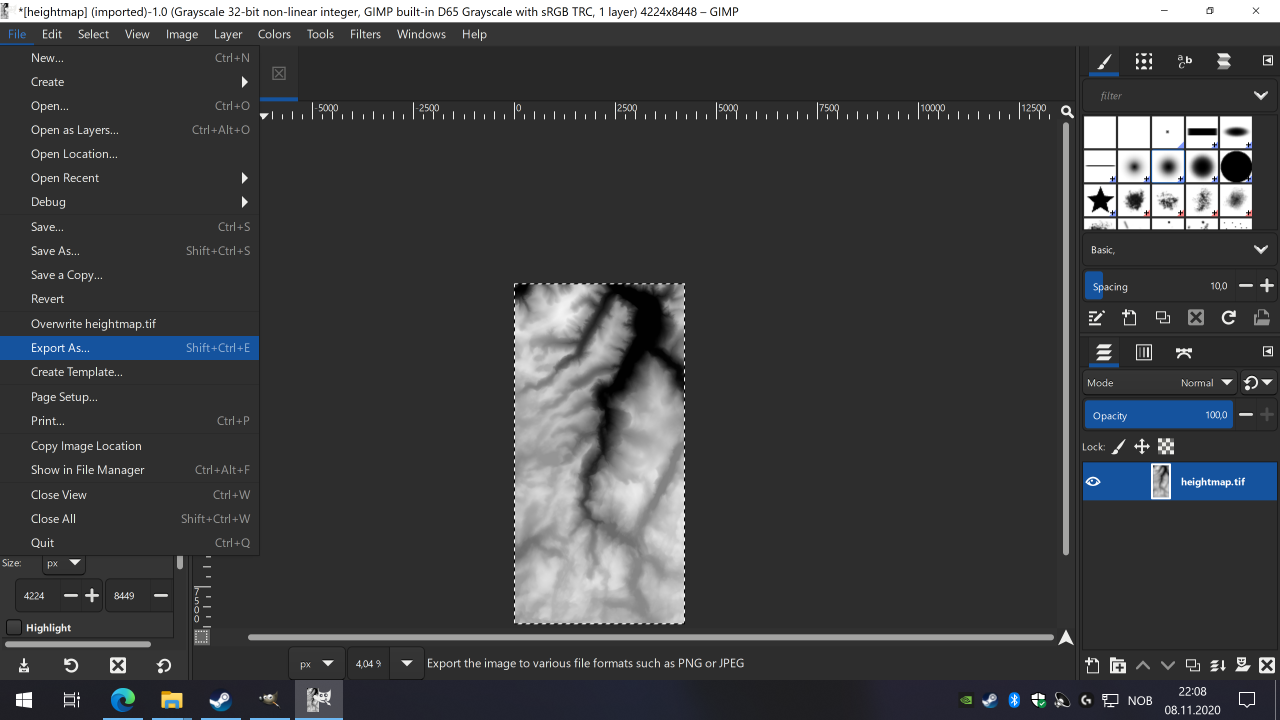
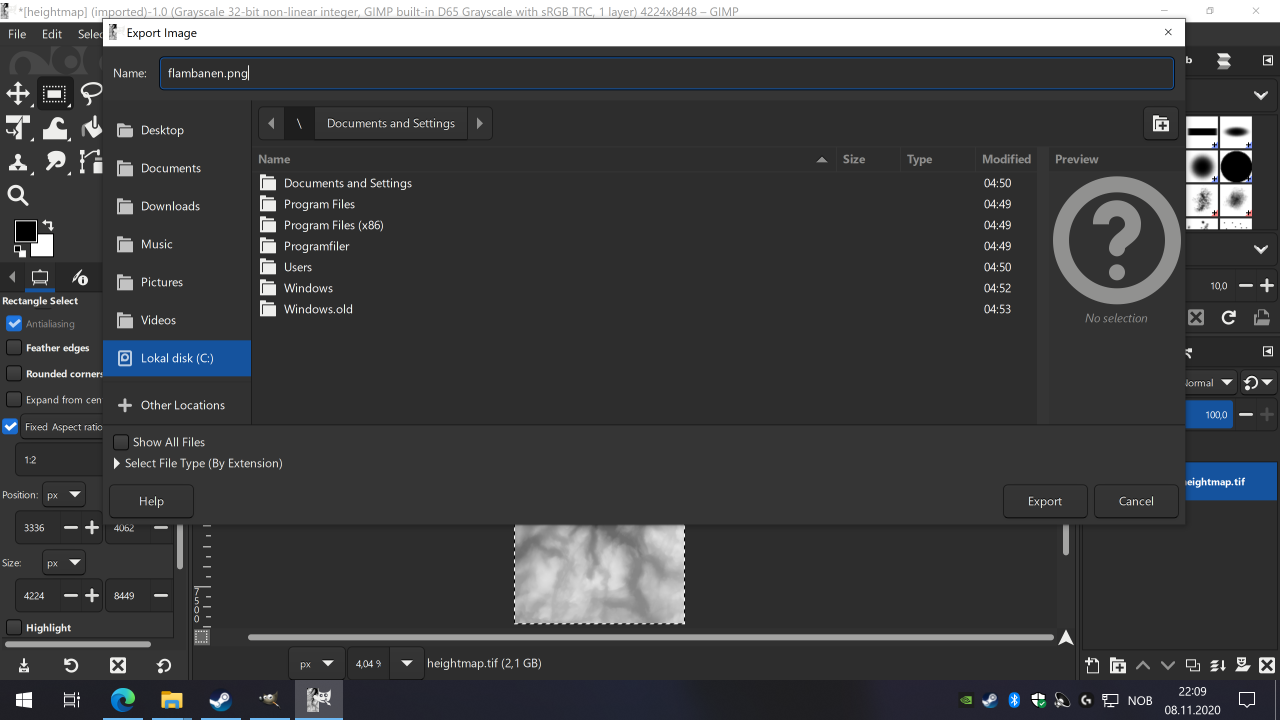
Chose a fitting filename, and ensure it ends in .png, because we have to save it as a PNG file for Transport Fever. I call it
as the map I am creating is the area where the Flåmsbanan[en.wikipedia.org] is running.
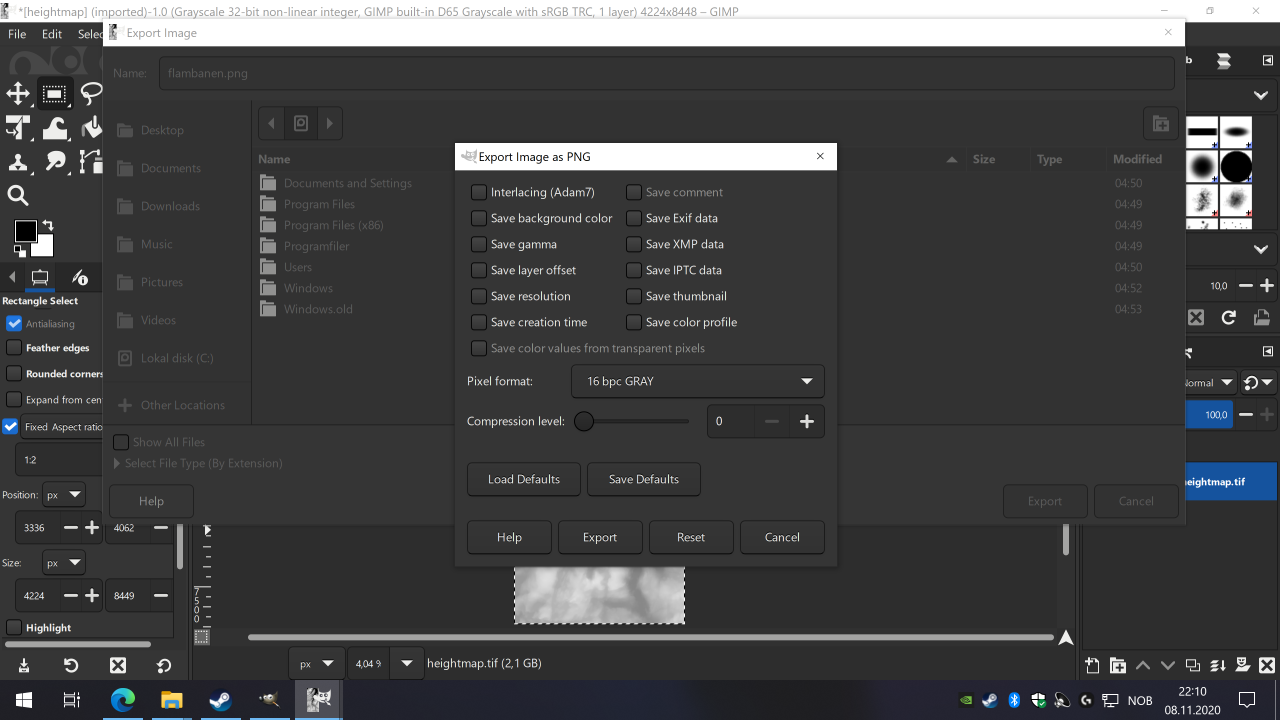
Click on [Export] and a new window with some settings comes up. You can uncheck everything but set Compression level: to 0 as it will open faster.
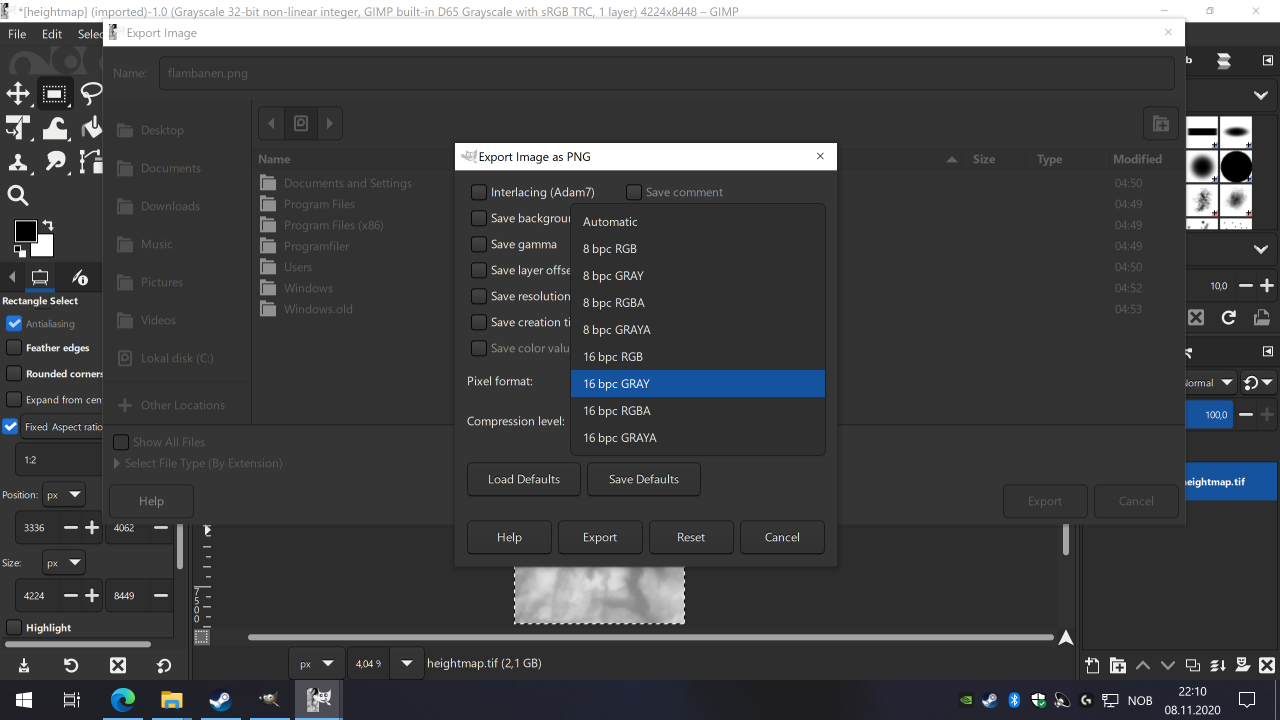
But the most important setting is the Pixel format: and must be set to [16 bpc GRAY].
Then click on [Export] and you can then close down GIMP if you want. Remember where you saved your new .png file.
3. Using our height map in Transport Fever 2
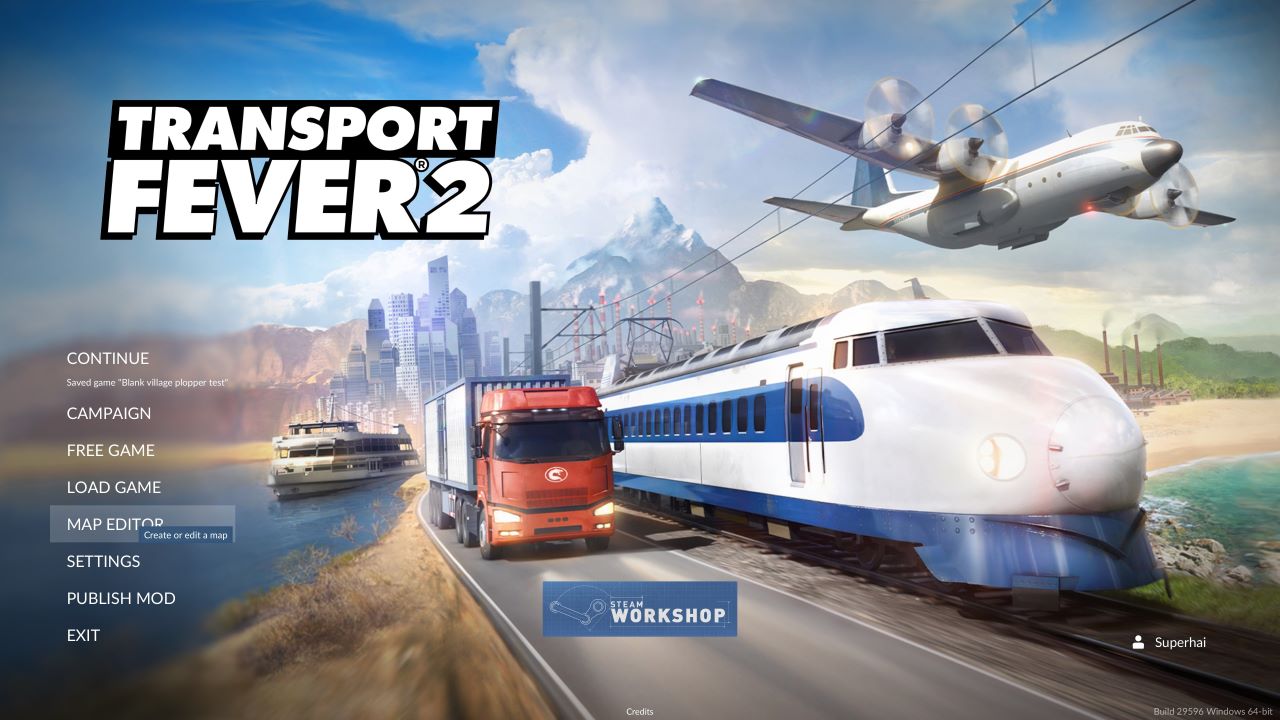
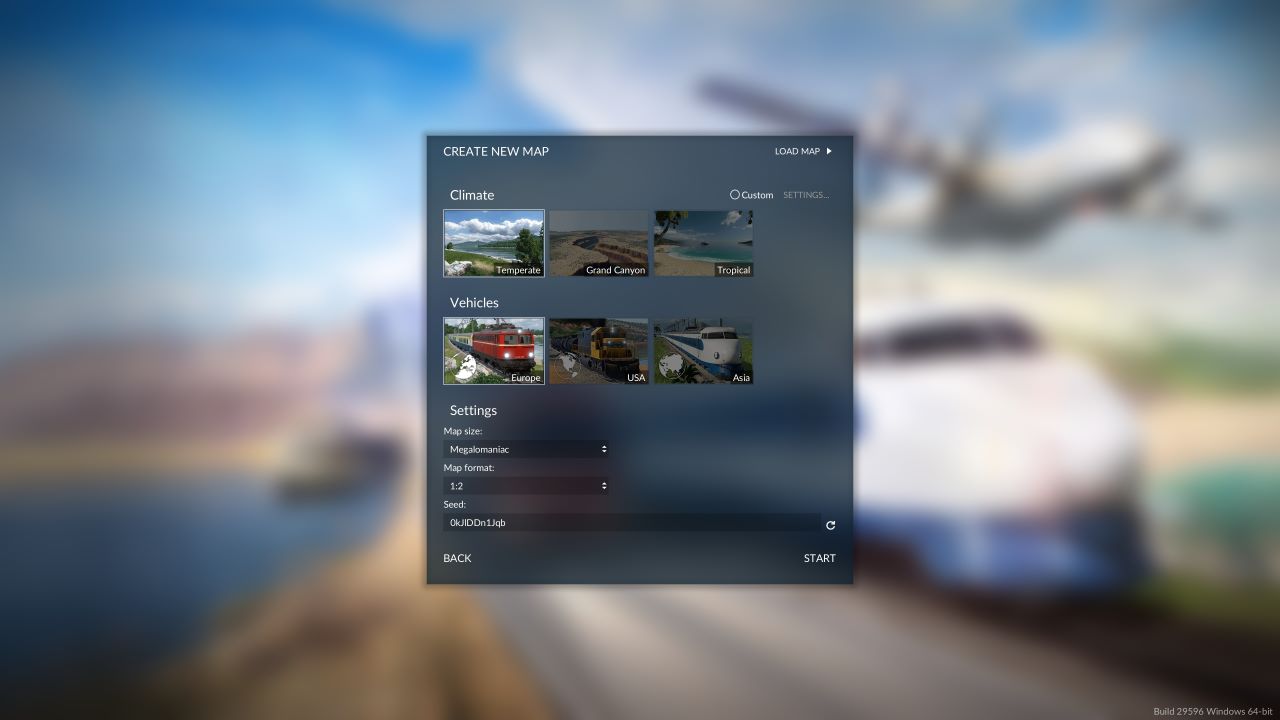
Make the necessary selections matching the map we have been working on. And click on [START].
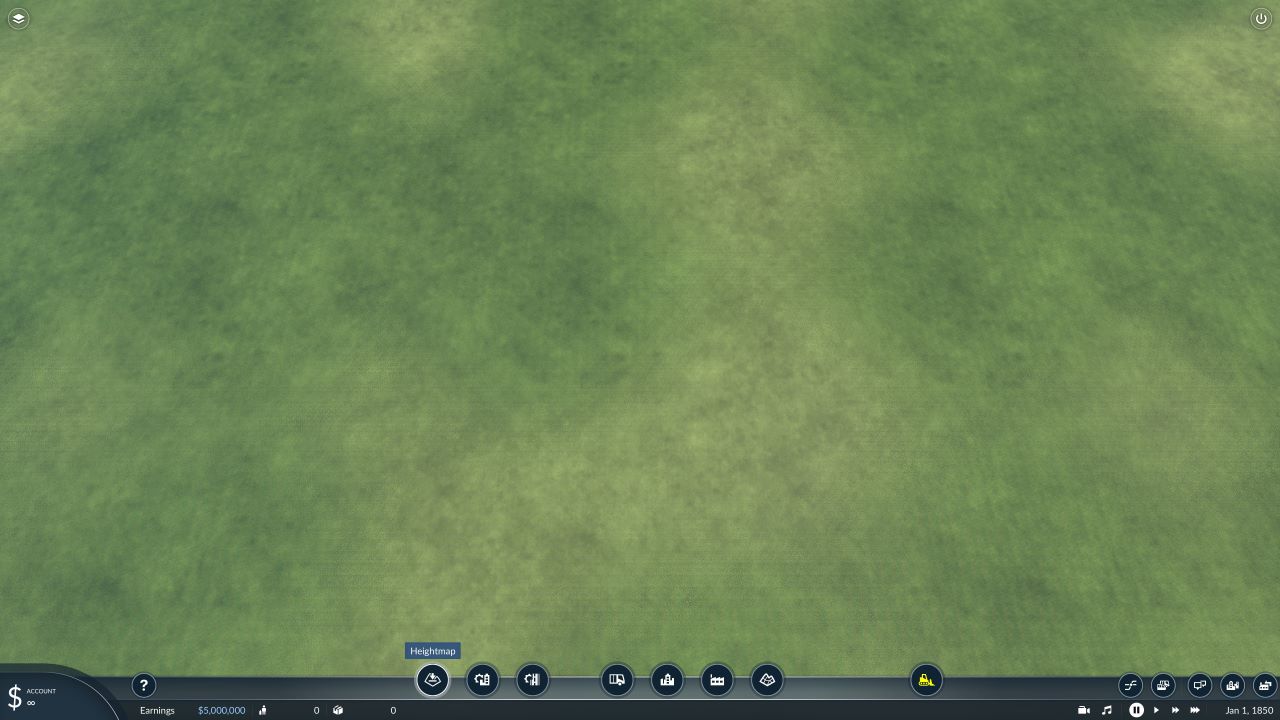
You should now be in the map editor, and in the main toolbar at the bottom, the first button should be called Heightmap and looks like a symbol of a kind of mountain with an arrow pointing down.
Click on it, and go to the Import tab. Note down the directory at the bottom of the window. You will have to copy your .png file to that one. Unfortunately you can’t copy the file path from the window, so you have to go there manually.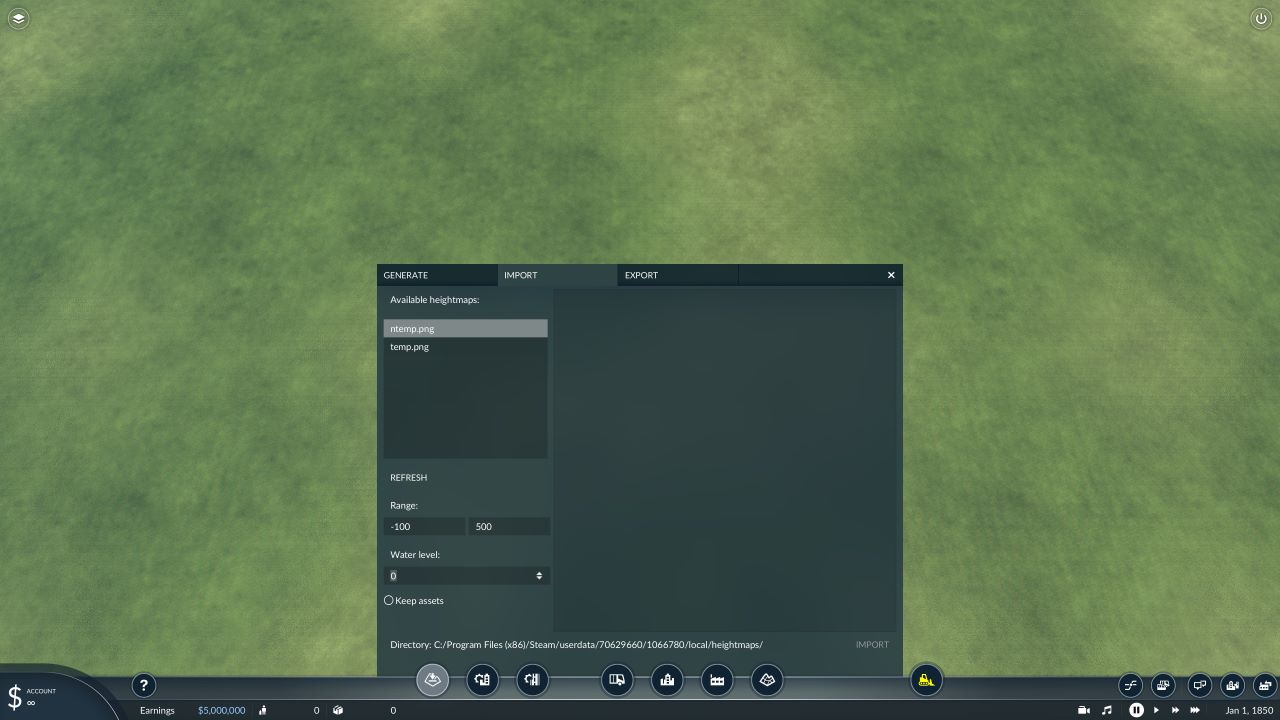
After you have copied the file, click on the [REFRESH] button in the window, and if all steps are completed properly, you should see the height map come up. Now click on it. You still have a few more edits to make in the window. If you see on the left side it says Range. If you remember that you wrote down some numbers from QGIS, now find them and enter them into that field. You will have to round them to the nearest integer. So for my map, the range is from -5 to 1834, and reflects the meters from the terrain elevation data. Water level should be 0.
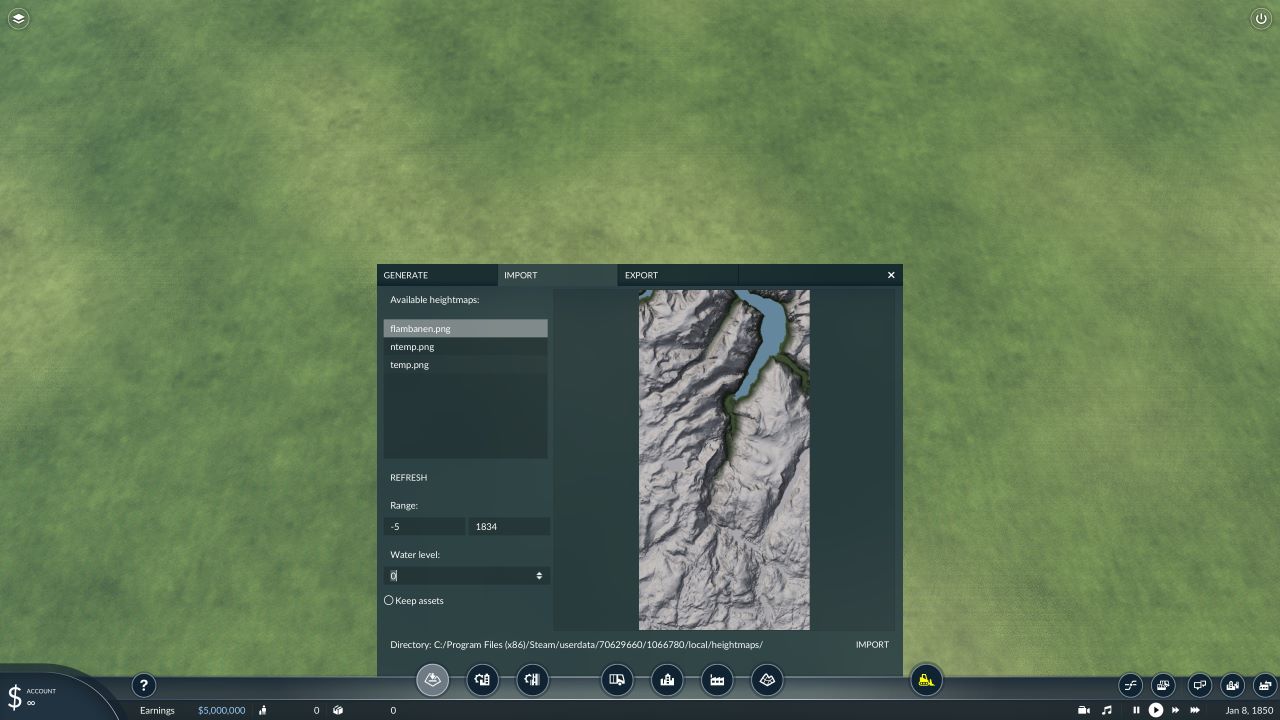
A few final notes on water and water level. Transport Fever 2 supports only one water level, which typically is set to the mean sea level. For bodies of water higher up, you can’t really use them as water, altough it is possible to use mods that creates something visually similar, but you can’t run boats on them. There is also often in the elevation data missing underwater data, which will manifest in various ways, depending on how it is implemented, typically you will have a very shallow sea. There are few ways to deal with this, one is to add more data in QGIS. Another option is to use the Map Editor in the game to manually fix the water. Or you can just leave it as is depending on how much it bothers you.
Now for the elevation data itself, there are some limitations in the game. Maximum height is 3176 meters, and minimum is -100. Also here there are a few options if you have terrain going above. One is to simply clip it, so anything above becomes the 3176 value. Another is to compress it, where the tallest tops becomes 3176, but the terrain will then be more level. If you have terrain where lowest point is higher than 0, let’s say it is 1500 m. Then you can set it to the lowest level, and adjust the height in relation to that.
Anyway, the last step is to click on [IMPORT] and let the game do its thing. It may take some time!
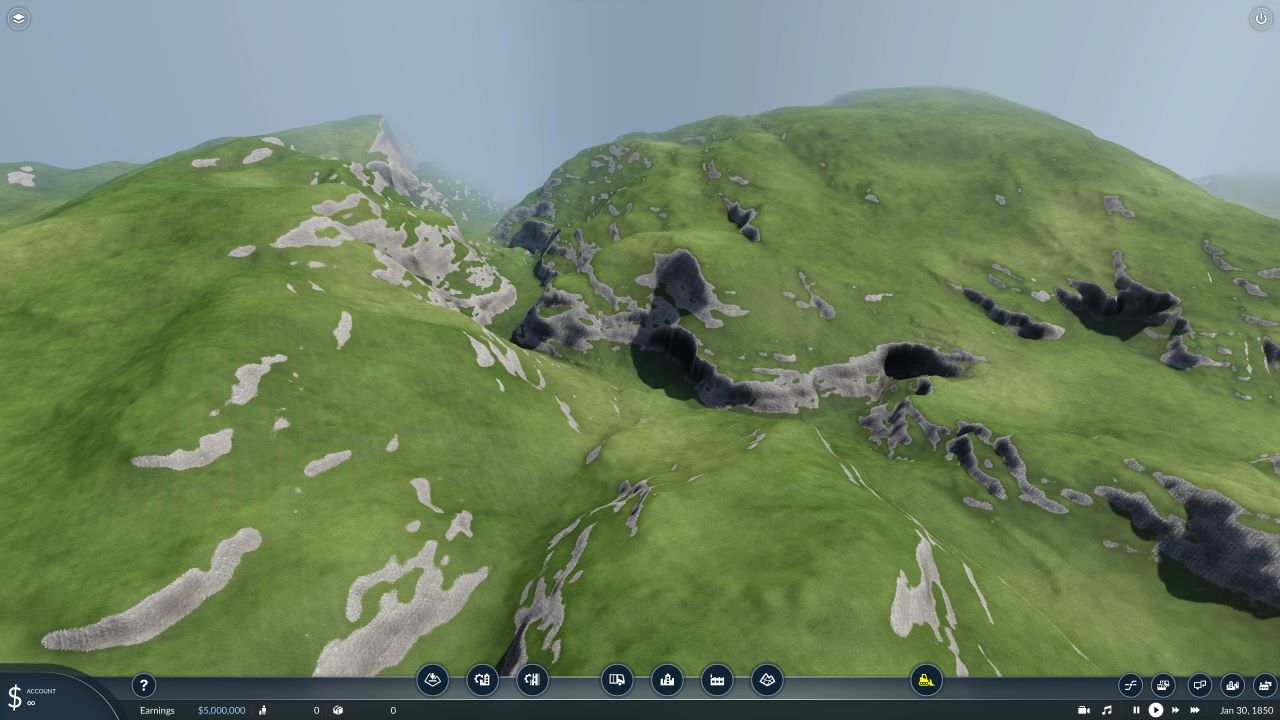
Hopefully it should look better than completely flat. Like this view over the top of the Flåms line starting point. Now it is time to lay some tracks, roads, and houses. If you have very hilly and mountaneous terrain, don’ expect it to be easy to make a profit!
Related Posts:
- Transport Fever 2: Beginners’ Tips
- Transport Fever 2: Asian Vehicle Lists
- Transport Fever 2: How to Enable Megalomaniac Mode
- Transport Fever 2: All Europe Vehicle Lists
