For Trade Bots: A Technical Analysis Simulation players, this guide will provide a basic understanding of what is VIX, what it means, and how it can be used.
Note: this guide is written based on the real-world VIX (not based on the in-game VIX); nothing here should be taken as trading advice. Do your own research, consult an expert, and don’t blame me for losses…
VIX & SPX Basics
The The Standard & Poors 500 (SPX) is an index of the top 500 publicly traded US companies. As it is an index, it cannot be traded in the same manner as an individual stock whereby an investor simply buys shares. The only way(s) to gain exposure to SPX are by derivatives such as European style Options and Futures, or exchange traded products (ETPs) such as ETFs and ETNs.
The CBOE Volatility index is calculated by looking at options on the SPX that are set to expire in 30 days. Options, Calls and Puts, are volatility-based derivatives that provide insight into expected movements of the underlying asset, in this case the SPX. As an index, the VIX can also only be traded via Euro Options, Futures, or ETPs, there are no underlying ‘shares’.
This image should summarize how the VIX relates back to the US economy:

In short: VIX is a derivative of a derivative that can only be traded using derivatives.
By looking at the Implied Volatility (IV or Impl Vol) of SPX options, the VIX provides valuable insights into the uncertainties within one of the world’s largest indices.
VIX Futures Term Structure
VIX futures trade under the tickers /VX for standard contracts and /VXM for minis.
Similar to the term structure of US treasuries (short term to long term bonds) yield curve; the forward values can be read and interpreted. An inverted yield curve often signals an economic downturn just as an inverted, or “backwardated”, VIX term structure indicated high amounts of near-term volatility.
The first image below demonstrates the VIX in contango (the most common state of the term structure) and the second show the VIX in backwardation (during high volatility markets, such as the start of the 2020 lock-downs):
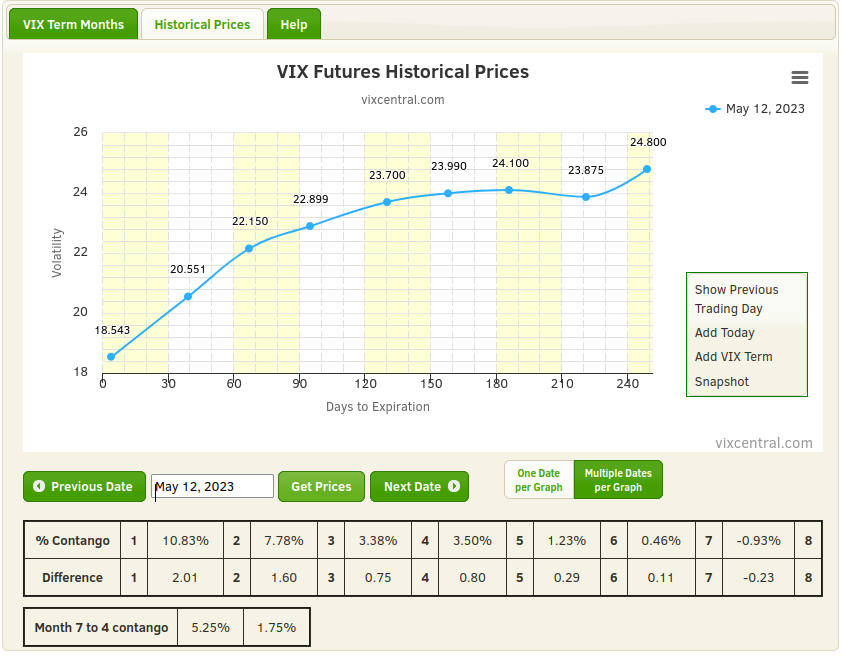
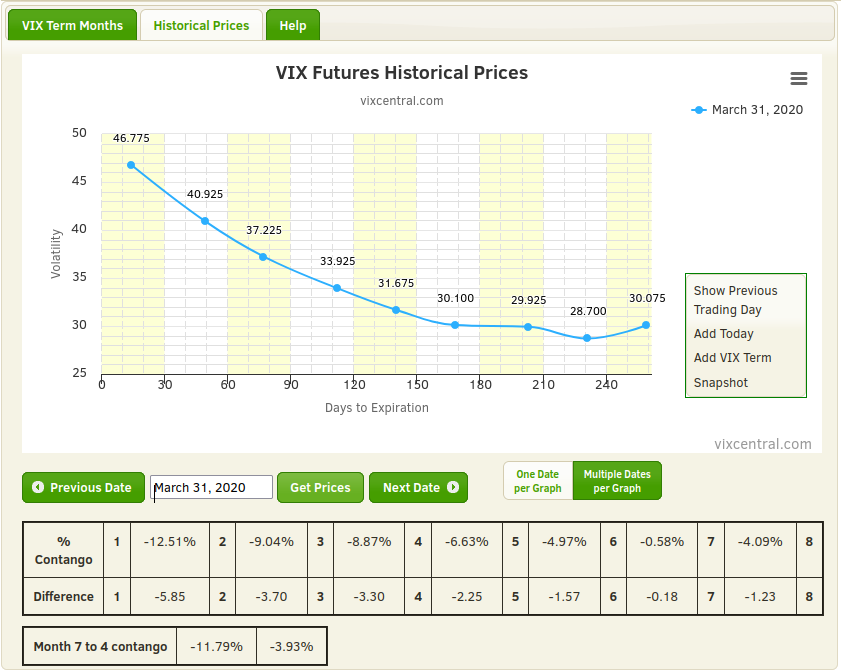
The view of the term structure itself is from different futures contract expirations. The ‘front month’ contract is known as “M1” and continues to “M2..M3..etc” as futures expire or ‘roll’ forward until the prior M2 now becomes M1. Vix Central[vixcentral.com] is an invaluable website for analyzing this phenomena.
For illustrative purposes we can replace the word “volatility” with “uncertainty” to further explore the VIX’s tendency towards contango. Normally there is more uncertainty about the distant future than the near future. If someone were to ask you “what will you have for dinner tonight” you might be able to narrow down the possibilities to the left overs in your fridge. If they were to ask you “what will you have for dinner this day next month” you might have reservations planned but aren’t sure what you’d be in the mood for or what’s on the menu. If they were to ask “what’s your dinner 1 year from now” you’d probably only have the most wild guess. Market volatility usually follows a similar process of narrowing down possibilities for price movement right up until the date of expiration for derivative contracts.
So why backwardation???
Backwardation occurs when the market is already experiencing high volatility. In the near term investors may be panicking or uncertain of what lies ahead. Similarly they know that within a year or two the market will probably adapt and overcome whatever the recent news has thrown at investors.
Reading The VIX
The VIX works similar to a Richter Graph Scale used for sensing Earthquakes and tectonic movement. That is to say- volatility ‘clusters’.
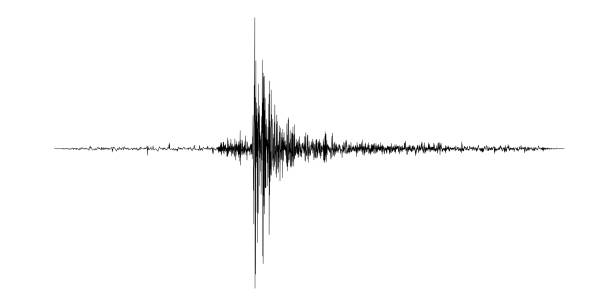
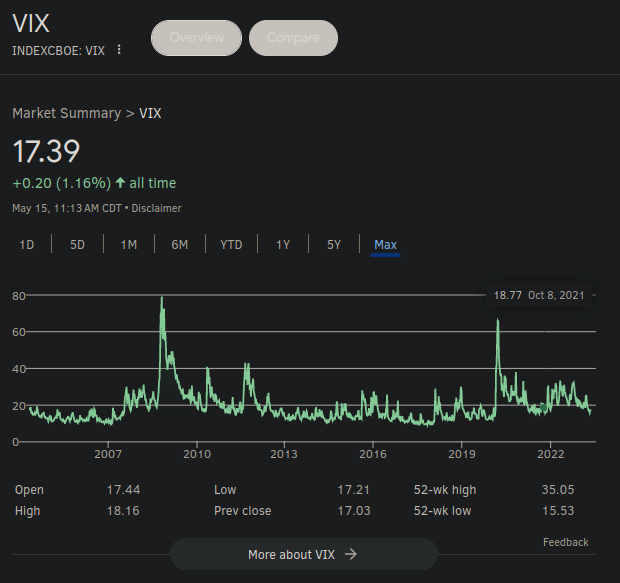 What appears to be small changes in increased volatility can quickly lead to much higher VIX values. Just as an Earthquake might begin with small tremors before larger devastation. Looking at the long term price history of the VIX we can see that it generally sits around a common value (discussed below) but will have large spikes that coincide with times of market turmoil. Intra-day charts would show increasing VIX values leading up to the large spikes on the max-timeline graph provided and as counterintuitive as it sounds; the best time to ‘long’ the VIX is when it’s already begun moving.
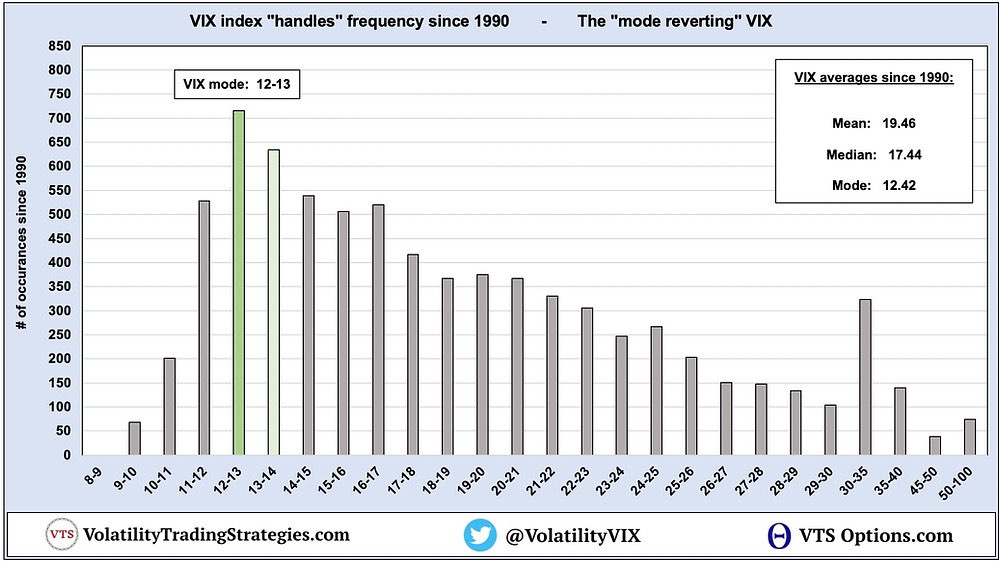
A common misconception about the VIX is that a value of N denotes safety or danger when buying traditional stocks of companies. You may hear people say “The VIX is back down to 25, it’s really low right now” or “VIX is up 2 points from yesterday, it’s really high at 10 right now”. The VIX is mean/mode reverting; meaning it tends to revert to ~19 or ~12 respectively.
During the Volpacalypse of 2018 the VIX had reached lows of ~9 which may have signaled to many investors “there’s nothing to worry about and the markets are calm”, this couldn’t have been further from the truth.
Another common misconception is that “The VIX is inverse to the markets” also known as “If SPX goes down VIX goes up and vice versa”. A slow and gradual decline in the SPX is not ‘volatile’ if it’s predictable or part of natural ebbs and flows of the market. Pay close attention to SPX on days such as these and you may notice that the VIX is declining while the SPX is also declining. Conversely, due to the nature of the VIX’s construction, a large and unpredictable upswing in SPX could cause the VIX to also spike.
But Why??
Without diving too far into options theory and pricing- Call options, also included in the VIX formula, are more sensitive to price movements than their counterpart; Put options. This is because a stock can only go down to 0 whereas it can go infinitely upwards. Because it’s difficult to price ‘infinite gains’ into an option, Call premium sellers take extra precautions to avoid getting run over.
This means, in theory, if the SPX doubled overnight, the VIX would see a massive spike. Possibly an even greater spike than if SPX were to have dropped by 50%.
The Takeaway:
1. Pay attention to the VIX Futures Term Structure
2. The VIX is mean/mode reverting
3. The raw value of the VIX can be deceiving
4. The VIX is it’s own bundle of joy, it’s is not an instrument for ‘inversing’ the market.
5. There is no singular metric that will outright predict VIX price movements, just of clues and trends to help you draw your own conclusions.
Volmageddon And The Volpacalypse of 2018
Retail traders and hedge fund managers had clued in on this phenomena and a substantial amount of money had been allocated to taking bearish positions on the VIX. In the midst of a bull market and with the VIX at historic lows, volatility came roaring back from the grave.
The over-crowding in short vol coupled with the rebalancing of M1:M2 futures hedging and a slight downturn in the SPX (of only ~4%) caused the VIX to more than double.
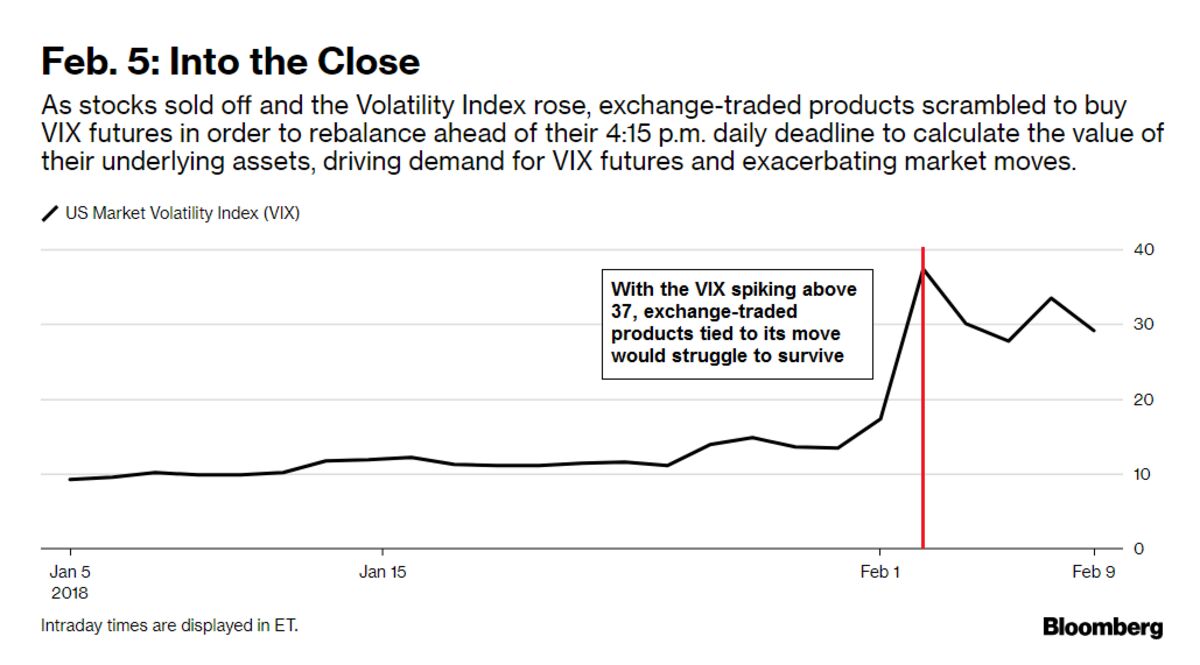
The events of this spike were dubbed “Volmageddon” or “The Volpacalypse” and left a lasting impact on some funds. Short VIX ETPs such as XIV and SVXY took a substantial loss as a result of their position and structuring. TVIX, a leveraged long VIX product, basically became unbound from the underlying as was erratically increasing alongside its underlying.
The observable effects of Volmageddon resemble a typical short squeeze[www.investopedia.com]. A more in-depth explanation of the Volpacalypse can be read here[houndstoothcapital.com].
Retrospectively a trader might think “with the VIX at historic lows… why shouldn’t I go long on it”. The problem with this approach is that the VIX can stay low, and even continue to decrease, for longer than you’re able to remain solvent. Derivatives have expiration dates and ETPs will continue to suffer decay and trading fees while waiting for the day they pop. Further more, the leveraged TVIX style products may not even properly reflect the magnitude of the spike should a trader be holding it (liquidity issues apply).
The Takeaway:
1. Shorting the VIX isn’t a sure thing and can be catastrophic if done incorrectly or at the wrong time.
2. Just because the VIX is at historic lows, doesn’t mean it’ll spike any time soon.
3. And again… The raw value of the VIX can be deceiving
Similar Indices
Many readers might be wondering “Why SPX, what about the Dow Jones and Nasdaq, or Russell. They have volatility too”. Although those indices also have options and futures, their respective volatility indices often do not have tradable markets. At time of writing; you can track, say Nasdaq vol, via ticker VXN but there are no derivatives to trade for it. Below is a table of other vol indices:
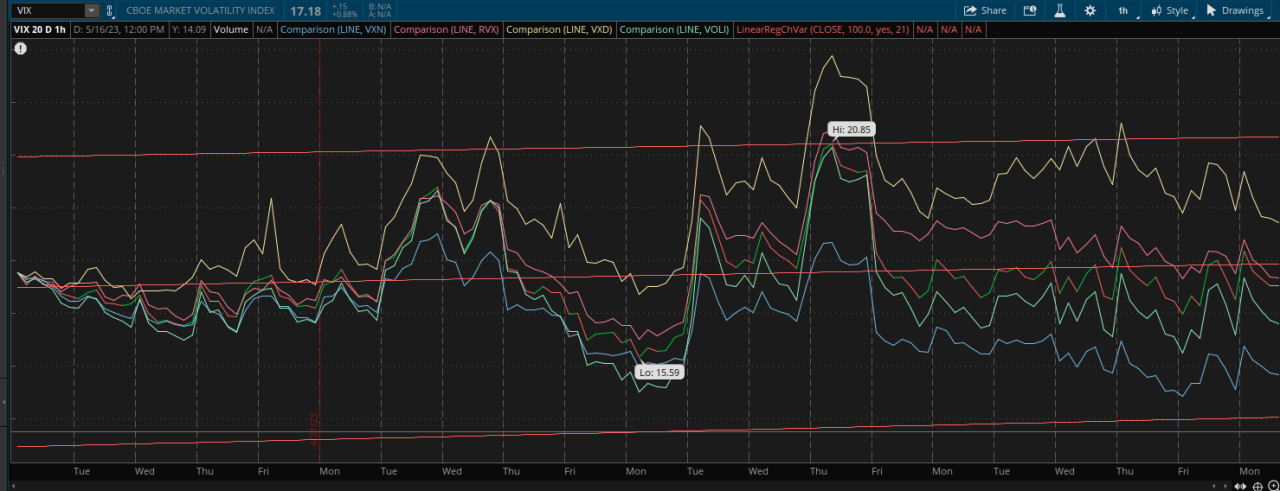
Interesting Alternative Vol Indices;
VVIX: The vol of vol
The VIX is calculated by a formula upon the SPX index. The VVIX is calculated, using the same formula, but upon the VIX itself.
VOLI: ATM Standard & Poors 500
The VIX uses a basket of 30 DTE options with varying strike prices. VOLI uses 30 DTE options as well but only the ATM (at-the-money) options. ATM options are the strike prices nearest the price of the underlying asset. Similarly, OTM options are out-of-the-money options further way from the trading price of the underlying.
Cash Products
There are also a number of VIX “cash products” which are untraded indicators that can help you clue-in to VIX calculations with different time horizons:

That’s all we are sharing today in Trade Bots: A Technical Analysis Simulation VIX Index Guide for Beginner, if you have anything to add, please feel free to leave a comment below, you can also read the original article here, all the credits goes to the original author DrDerpenstein
